1. You draw one card randomly from a standard deck of 52 playing cards (no jokers)
Event A: You draw a heart card.
Event B: You draw a card that is not a face card.
Event C: You draw a non-face card that is divisible by 3.
What is the probability that Event A, B, or C will occur?
2. Empirically verify the probability you calculated in Problem 1 with a Python program that simulates drawing randomly from a deck of cards. Initialize a list of cards, each card with a suit and a value. Generate a random number 0 through 51 to pick a card from the list. Check for Events A, B, and C. Repeat this a million times and count how many times Event A, B, or C occurred. After a million card picks, print your count divided by a million. How well does this simulation probability match the probability you calculated in Problem 9? Also print the simulation probabilities after 100; 1,000; 10,000; and 100,000 card picks. Determine how many simulated card picks are needed for the simulation probability to match your calculated probability to 3 decimal places.
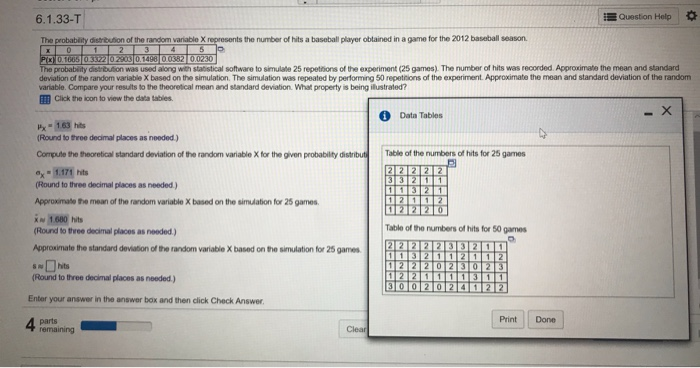
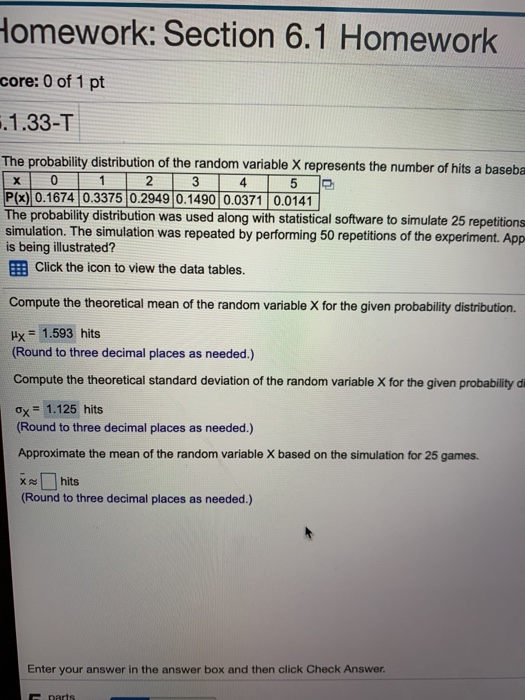
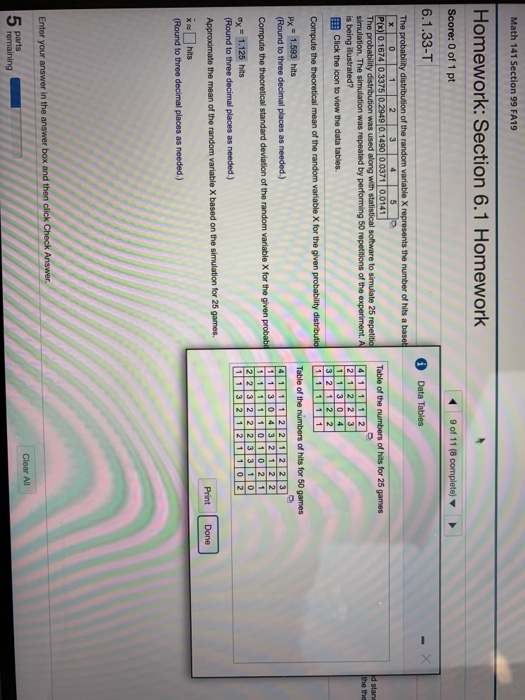
6.1.33-T Question Holp The probability distribution of the random variable X represents the number of hits a baseball player obtained in a game for the 2012 baseball season. I Pyx| 0. 1606 0 3372 02:03 0.1488 010382 0.0230 The probability distribution was used along with statistical software to simulate 25 repetitions of the experiment (25 games) The number of hits was recorded. Approximate the mean and standard deviation of the random variable X based on the simulation. The simulation was repeated by performing 50 repetitions of the experiment. Approximate the moan and standard deviation of the random variable. Compare your results to the theoretical moan and standard deviation. What property is being illustrated? ITif Click the icon to view the data tables. Data Tables - X Hy = 1.63 hits (Round to from decimal places as nooded ) Compute the theoretical standard deviation of the random variable X for the given probability distribute Table of the numbers of hits for 25 games 8 = 1.171 hits 2 2 2 2 2 3 3 2 1 1 (Round to three decimal places as needed) 1 13 2 1 Approximate the maan of the random variable X based on the simulation for 25 games. 1 2 1 1 12 2 20 Aw 1.600 hits (Found to three decimal places as needed) Table of the numbers of hits for 50 games Approximate the standard deviation of the random variable X based on the simulation for 25 games. 1 1 3 2 1 1 2 1 2 12 2 2 0 2 3 0 2 3 (Round to three decimal places as needed.) 1 2 2 1 1 1 1 3 1 1 30 020 2 12 2 Enter your answer in the answer box and then click Chock Answer. parts Print Done 4 remaining Clearlomework: Section 6.1 Homework core: 0 of 1 pt .1.33-T The probability distribution of the random variable X represents the number of hits a baseba X 0 2 3 4 5 P(x) 0.1674 0.3375 0.2949 0.1490 0.0371 0.0141 The probability distribution was used along with statistical software to simulate 25 repetitions simulation. The simulation was repeated by performing 50 repetitions of the experiment. App is being illustrated? Click the icon to view the data tables. Compute the theoretical mean of the random variable X for the given probability distribution. Hx = 1.593 hits (Round to three decimal places as needed.) Compute the theoretical standard deviation of the random variable X for the given probability d Ox = 1.125 hits (Round to three decimal places as needed.) Approximate the mean of the random variable X based on the simulation for 25 games. * = hits (Round to three decimal places as needed.) Enter your answer in the answer box and then click Check Answer.Math 141 Section 99 FA19 Homework: Section 6.1 Homework Score: 0 of 1 pt 9 of 11 (8 complete] A 6.1.33-T Data Tables X The probability distribution of the random variable X represents the number of hits a based 3 4 5 3 P(x) 0.1674 0.3375 0.2949 0.1490 0.0371 0.0141 Table of the numbers of hits for 25 games The probability distribution was used along with statistical software to simulate 25 repetitio Id star simulation. The simulation was repeated by performing 50 repetitions of the experiment. A 4 1 1 1 2 the the is being illustrated? 212 2 3 Iff Click the Icon to view the data tables. 1 1 3 0 4 3 2 1 2 2 Compute the theoretical mean of the random variable X for the given probability distribution 1 1 1 1 1 Hx = 1.593 hits Table of the numbers of hits for 50 games (Round to three decimal places as needed.) 41 1 1 2 2 1 2 2 3 Compute the theoretical standard deviation of the random variable X for the given probabil 1 1 3 0 4 3 2 1 2 2 1 1 1 1 1 0 1 0 2 1 Dy = 1.125 hits 2 2 3 2 2 2 3 3 1 0 (Round to three decimal places as needed.) 1 1 3 2 1 2 1 1 0 2 Approximate the mean of the random variable X based on the simulation for 25 games. Print Done i se hits (Round to three decimal places as needed.) Enter your answer in the answer box and then click Check Answer. parts Clear All remaining