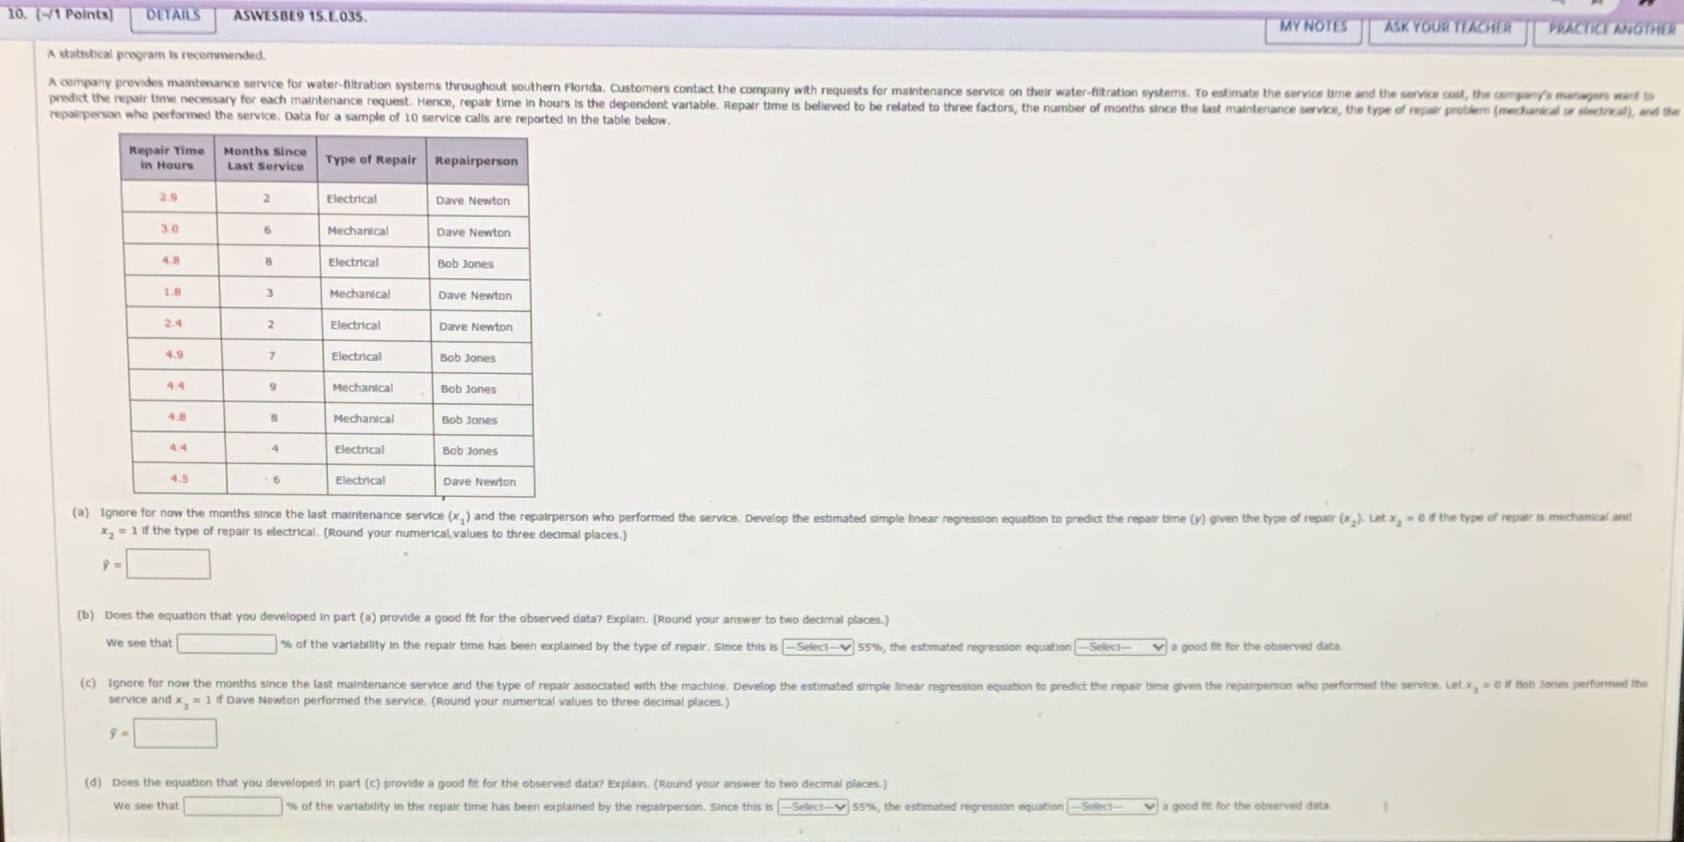
10. [-1 Points] DETAILS ASWESBE9 15.E.035. MY NOTES ASK YOUR TEACHER PRACTICE ANOTHER A statistical program is recommended. A company provides maintenance service for water-filtration systems throughout southern Florida. Customers contact the company with requests for maintenance service on their water-filtration systems. To estimate the service time and the service cost, the company's managers want to predict the repair time necessary for each maintenance request. Hence, repair time in hours is the dependent variable. Repair time is believed to be related to three factors, the number of months since the last maintenance service, the type of repair problems (mechanical or slectincal), and the repairperson who performed the service. Data for a sample of 10 service calls are reported in the table below. Repair Time Months Since in Hours Last Service Type of Repair Repairperson 2.9 Electrical Dave Newton 30 Mechanical Dave Newton 4.8 B Electrical Bob Jones 1.8 3 Mechanical Dave Newton 2.4 2 Electrical Dave Newton 4.9 7 Electrical Bob Jones 4.4 9 Mechanical Bob Jones 4.8 8 Mechanical Bob Jones 4.4 Electrical Bob Jones 4.5 6 Electrical Dave Newton (a) Ignore for now the months since the last maintenance service (x, ) and the repairperson who performed the service. Develop the estimated simple linear regression equation to predict the repair time () given the type of repair (x, ). Let x, = 0 if the type of repair is mechanical and x, = 1 if the type of repair is electrical. (Round your numerical values to three decimal places.) (b) Does the equation that you developed in part (a) provide a good fit for the observed data? Explain. (Round your answer to two decimal places.) we see that of the variability in the repair time has been explained by the type of repair. Since this Is -Select-V|55%, the estimated regression equation a good fit for the observed data. (c) Ignore for now the months since the last maintenance service and the type of repair associated with the machine, Develop the estimated simple linear regre on equation to predict the repair time given the repairperson who performed the service. Let x, = 0 if Bob Jones performed the service and x. = 1 if Dave Newton performed the service. (Round your numerical values to three decimal places.) (d) Does the equation that you developed in part (c) provide a good fit for the observed data? Explain, (Round your answer to two decimal places.) We see that % of the variability in the repair time has been explained by the repairperson. Since this Is |-Select-v| 55%, the estimated regression equation Select- v a good fit for the observed data


