Answered step by step
Verified Expert Solution
Link Copied!

Question

1 Approved Answer

10 12 13 15 16 18 Mat 170-703 Name: Project #3 - 100 points (10 point per day penalty if late) Spring 2022 - Due

image text in transcribedimage text in transcribedimage text in transcribed
10 12 13 15 16 18 Mat 170-703 Name: Project #3 - 100 points (10 point per day penalty if late) Spring 2022 - Due Thursday, April 21st . Problem: A statistics professor gives an exam that is worth a maximum of 50 points. The teacher knows from past experience that the test scores are normally distributed with a mean score of 33 and a standard deviation of 5.5 The original grade scale is 45-50 is an A; 40-44 is a B; 35-39 is a C; 30-34 is a D; and 29 or less is an F. Since this exam was particularly tough, the teacher decides to curve the test scores. Questions: If the professor simply adds 5 points to everyone's test score, what is the new mean? What is the new standard deviation? This question has nothing to do with the rest of the project! You are to answer it but not use it anywhere else!! If the grades are curved using the following parameters (instead of simply adding more points to each test), find the numerical limits for each letter grade. Round each new value in the grade scale to the nearest whole number. A: Top 10% (also known as the 90 percentile) B: Scores above the bottom 70% and below the top 10% (the 70th "percentile) C: Scores above the bottom 30% and below the top 30% (the 30thp "percentile) D: Scores above the bottom 10% and below the top 70% (the 10" percentile) F: Bottom 10% Using the teacher's original grade scale, if one student is selected at random, what is the probability that the test score is a 'B' or higher? Remember that the exam has a maximum possible 50 points. What is the probability of getting 'B' or higher when you select one student at random using the 'new' grade scale from #2? Remember that the exam has a maximum possible 50 points.10 12 13 15 16 18 Using the original grade scale and selecting 6 students at random, what is the probability that their mean score would be an 'A'? Can the Central Limit Theorem be used in this case even though the sample is small? Why? In an attempt to get an estimate of the proportion of his students that generally pass his exam; the statistics professor takes a sample of his data from past classes. He finds that in a sample of 200 test scores, 135 students got a passing grade. He then calculated the following 95% confidence interval estimate based on this sample: 61%

Step by Step Solution

There are 3 Steps involved in it

Step: 1

blur-text-image

Get Instant Access to Expert-Tailored Solutions

See step-by-step solutions with expert insights and AI powered tools for academic success

Step: 2

blur-text-image

Step: 3

blur-text-image

Ace Your Homework with AI

Get the answers you need in no time with our AI-driven, step-by-step assistance

Get Started

Recommended Textbook for

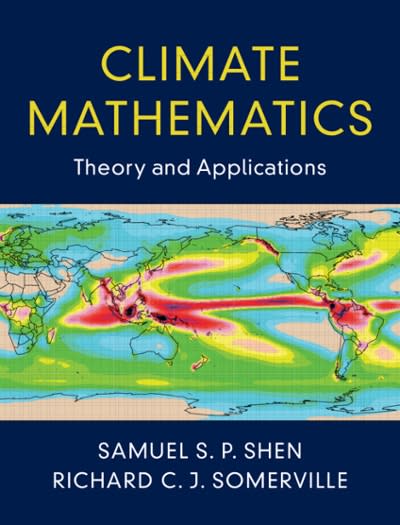
Climate Mathematics Theory And Applications

Authors: Samuel S P Shen, Richard C J Somerville

1st Edition

1108750184, 9781108750189

More Books

Students also viewed these Mathematics questions

Question

Differentiate trade receivables from notes receivable.

Answered: 1 week ago

Question

What were the Basel Accords and what was their purpose?

Answered: 1 week ago

Question

Define promotion.

Answered: 1 week ago

Question

Write a note on transfer policy.

Answered: 1 week ago

Question

Discuss about training and development in India?

Answered: 1 week ago

Question

Explain the various techniques of training and development.

Answered: 1 week ago

Question

1. I try to create an image of the message

Answered: 1 week ago

Question

4. What is the goal of the others in the network?

Answered: 1 week ago