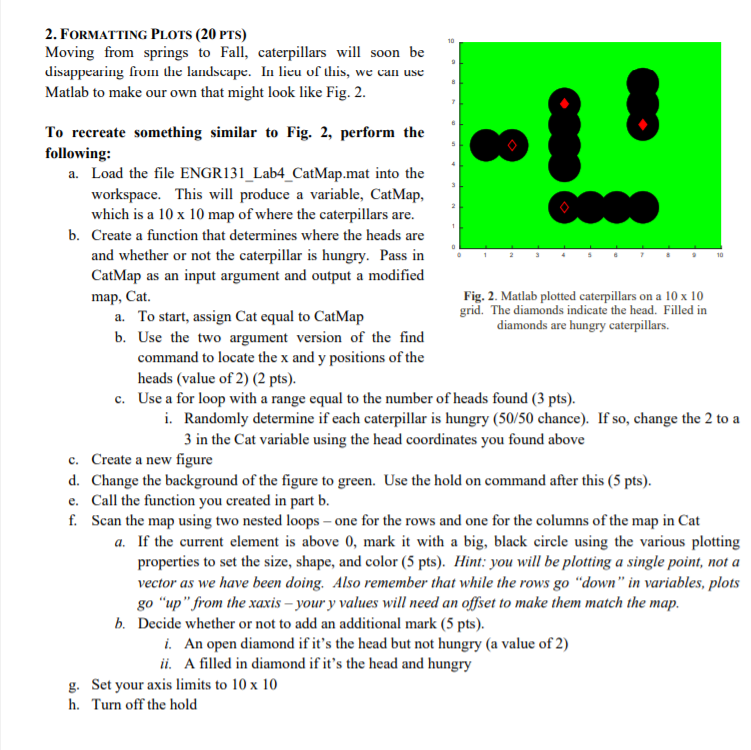
10 2. FORMATTING PLOTS (20 PTS) Moving from springs to Fall, caterpillars will soon be disappearing from the landscape. In lieu of this, we can use Matlab to make our own that might look like Fig. 2. 9 2 10 To recreate something similar to Fig. 2, perform the following: a. Load the file ENGR131_Lab4_CatMap.mat into the workspace. This will produce a variable, CatMap, which is a 10 x 10 map of where the caterpillars are. b. Create a function that determines where the heads are and whether or not the caterpillar is hungry. Pass in CatMap as an input argument and output a modified map, Cat. Fig. 2. Matlab plotted caterpillars on a 10 x 10 a. To start, assign Cat equal to CatMap grid. The diamonds indicate the head. Filled in diamonds are hungry caterpillars. b. Use the two argument version of the find command to locate the x and y positions of the heads (value of 2) (2 pts). c. Use a for loop with a range equal to the number of heads found (3 pts). i. Randomly determine if each caterpillar is hungry (50/50 chance). If so, change the 2 to a 3 in the Cat variable using the head coordinates you found above c. Create a new figure d. Change the background of the figure to green. Use the hold on command after this (5 pts). e. Call the function you created in part b. f. Scan the map using two nested loops - one for the rows and one for the columns of the map in Cat a. If the current element is above 0, mark it with a big, black circle using the various plotting properties to set the size, shape, and color (5 pts). Hint: you will be plotting a single point, not a vector as we have been doing. Also remember that while the rows go "down" in variables, plots go up from the xaxis - your y values will need an offset to make them match the map. b. Decide whether or not to add an additional mark (5 pts). i. An open diamond if it's the head but not hungry (a value of 2) ii. A filled in diamond if it's the head and hungry g. Set your axis limits to 10 x 10 h. Turn off the hold 10 2. FORMATTING PLOTS (20 PTS) Moving from springs to Fall, caterpillars will soon be disappearing from the landscape. In lieu of this, we can use Matlab to make our own that might look like Fig. 2. 9 2 10 To recreate something similar to Fig. 2, perform the following: a. Load the file ENGR131_Lab4_CatMap.mat into the workspace. This will produce a variable, CatMap, which is a 10 x 10 map of where the caterpillars are. b. Create a function that determines where the heads are and whether or not the caterpillar is hungry. Pass in CatMap as an input argument and output a modified map, Cat. Fig. 2. Matlab plotted caterpillars on a 10 x 10 a. To start, assign Cat equal to CatMap grid. The diamonds indicate the head. Filled in diamonds are hungry caterpillars. b. Use the two argument version of the find command to locate the x and y positions of the heads (value of 2) (2 pts). c. Use a for loop with a range equal to the number of heads found (3 pts). i. Randomly determine if each caterpillar is hungry (50/50 chance). If so, change the 2 to a 3 in the Cat variable using the head coordinates you found above c. Create a new figure d. Change the background of the figure to green. Use the hold on command after this (5 pts). e. Call the function you created in part b. f. Scan the map using two nested loops - one for the rows and one for the columns of the map in Cat a. If the current element is above 0, mark it with a big, black circle using the various plotting properties to set the size, shape, and color (5 pts). Hint: you will be plotting a single point, not a vector as we have been doing. Also remember that while the rows go "down" in variables, plots go up from the xaxis - your y values will need an offset to make them match the map. b. Decide whether or not to add an additional mark (5 pts). i. An open diamond if it's the head but not hungry (a value of 2) ii. A filled in diamond if it's the head and hungry g. Set your axis limits to 10 x 10 h. Turn off the hold