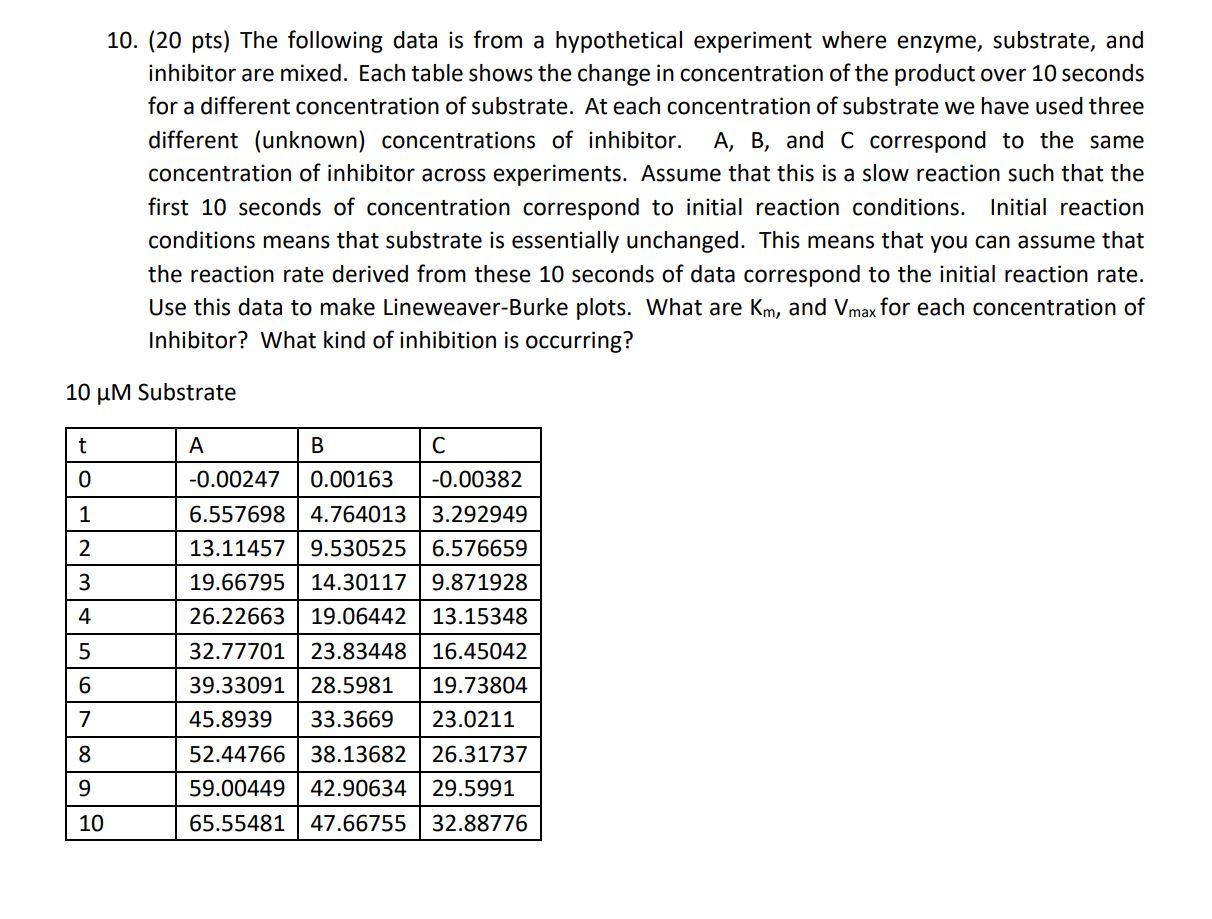
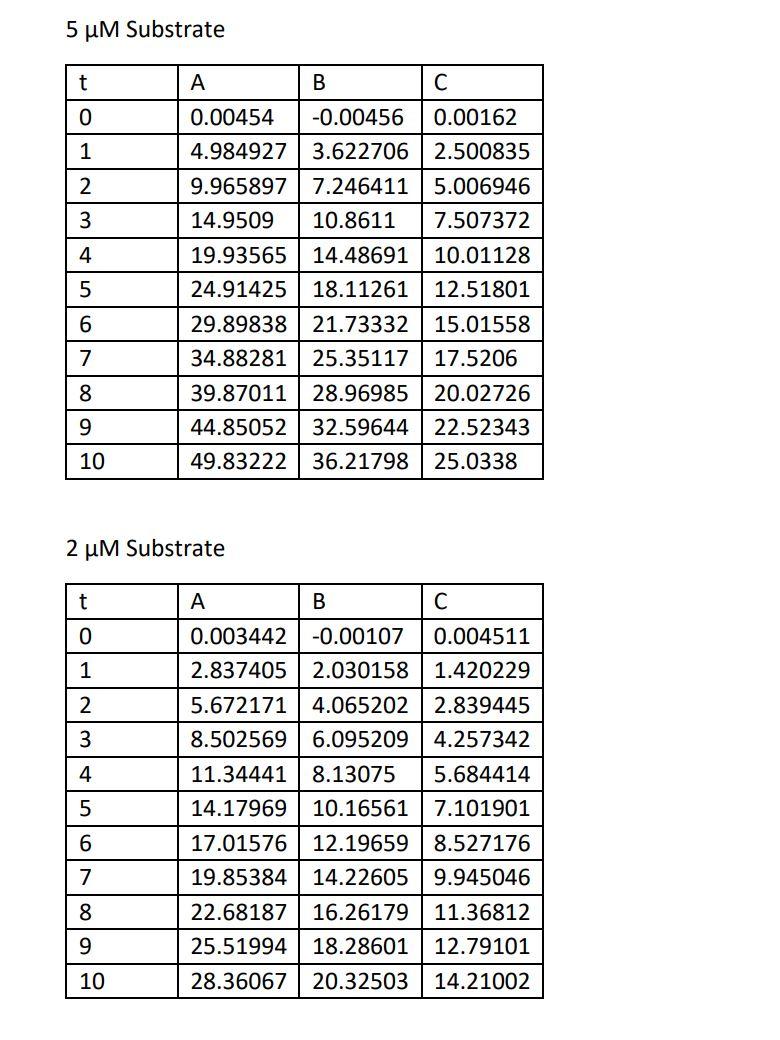
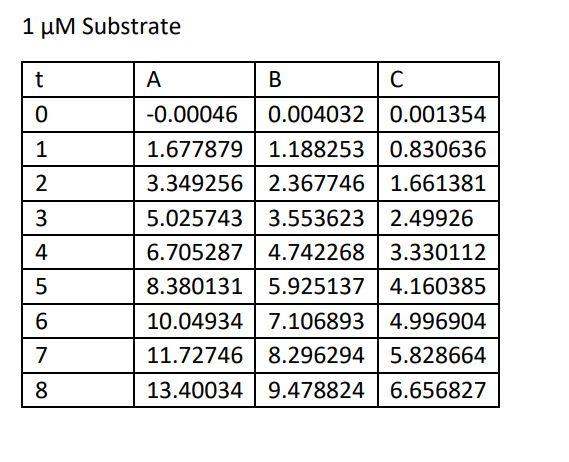
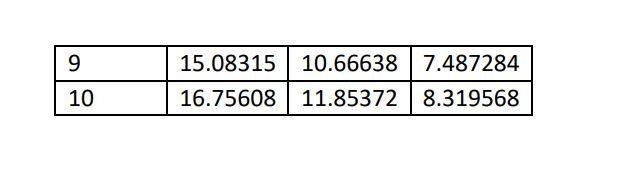
10. (20 pts) The following data is from a hypothetical experiment where enzyme, substrate, and inhibitor are mixed. Each table shows the change in concentration of the product over 10 seconds for a different concentration of substrate. At each concentration of substrate we have used three different (unknown) concentrations of inhibitor. A, B, and C correspond to the same concentration of inhibitor across experiments. Assume that this is a slow reaction such that the first 10 seconds of concentration correspond to initial reaction conditions. Initial reaction conditions means that substrate is essentially unchanged. This means that you can assume that the reaction rate derived from these 10 seconds of data correspond to the initial reaction rate. Use this data to make Lineweaver-Burke plots. What are Km, and Vmax for each concentration of Inhibitor? What kind of inhibition is occurring? 10 um Substrate t A B C 0 1 -0.00247 6.557698 13.11457 19.66795 2 3 4 5 26.22663 32.77701 39.33091 45.8939 0.00163 -0.00382 4.764013 3.292949 9.530525 6.576659 14.30117 9.871928 19.06442 13.15348 23.83448 16.45042 28.5981 19.73804 33.3669 23.0211 38.13682 26.31737 42.90634 29.5991 47.66755 32.88776 6 7 8 9 52.44766 59.00449 65.55481 10 5 UM Substrate t B C 0 1 2 3 4 5 0.00454 -0.00456 0.00162 4.984927 3.622706 2.500835 9.965897 7.246411 5.006946 14.9509 10.8611 7.507372 19.93565 14.48691 10.01128 24.91425 18.11261 12.51801 29.89838 21.73332 15.01558 34.88281 25.35117 17.5206 39.87011 | 28.96985 20.02726 44.85052 32.59644 22.52343 49.83222 36.21798 25.0338 6 7 8 9 10 2 UM Substrate t A B C 0 0.004511 1.420229 1 0.003442 2.837405 5.672171 8.502569 -0.00107 2.030158 4.065202 2 3 6.095209 2.839445 4.257342 5.684414 7.101901 4 11.34441 5 14.17969 6 8.527176 8.13075 10.16561 12.19659 14.22605 16.26179 18.28601 17.01576 19.85384 22.68187 25.51994 7 8 9.945046 11.36812 12.79101 9 10 28.36067 20.32503 14.21002 1 uM Substrate t A B C 0 1 2 3 4 -0.00046 0.004032 0.001354 1.677879 1.188253 0.830636 3.349256 2.367746 1.661381 5.0257433.553623 2.49926 6.705287 4.742268 3.330112 8.380131 5.925137 4.160385 10.04934 7.1068934.996904 11.72746 8.296294 5.828664 13.40034 9.478824 6.656827 5 6 7 8 9 15.08315 10.66638 7.487284 16.75608 11.85372 8.319568 10 10. (20 pts) The following data is from a hypothetical experiment where enzyme, substrate, and inhibitor are mixed. Each table shows the change in concentration of the product over 10 seconds for a different concentration of substrate. At each concentration of substrate we have used three different (unknown) concentrations of inhibitor. A, B, and C correspond to the same concentration of inhibitor across experiments. Assume that this is a slow reaction such that the first 10 seconds of concentration correspond to initial reaction conditions. Initial reaction conditions means that substrate is essentially unchanged. This means that you can assume that the reaction rate derived from these 10 seconds of data correspond to the initial reaction rate. Use this data to make Lineweaver-Burke plots. What are Km, and Vmax for each concentration of Inhibitor? What kind of inhibition is occurring? 10 um Substrate t A B C 0 1 -0.00247 6.557698 13.11457 19.66795 2 3 4 5 26.22663 32.77701 39.33091 45.8939 0.00163 -0.00382 4.764013 3.292949 9.530525 6.576659 14.30117 9.871928 19.06442 13.15348 23.83448 16.45042 28.5981 19.73804 33.3669 23.0211 38.13682 26.31737 42.90634 29.5991 47.66755 32.88776 6 7 8 9 52.44766 59.00449 65.55481 10 5 UM Substrate t B C 0 1 2 3 4 5 0.00454 -0.00456 0.00162 4.984927 3.622706 2.500835 9.965897 7.246411 5.006946 14.9509 10.8611 7.507372 19.93565 14.48691 10.01128 24.91425 18.11261 12.51801 29.89838 21.73332 15.01558 34.88281 25.35117 17.5206 39.87011 | 28.96985 20.02726 44.85052 32.59644 22.52343 49.83222 36.21798 25.0338 6 7 8 9 10 2 UM Substrate t A B C 0 0.004511 1.420229 1 0.003442 2.837405 5.672171 8.502569 -0.00107 2.030158 4.065202 2 3 6.095209 2.839445 4.257342 5.684414 7.101901 4 11.34441 5 14.17969 6 8.527176 8.13075 10.16561 12.19659 14.22605 16.26179 18.28601 17.01576 19.85384 22.68187 25.51994 7 8 9.945046 11.36812 12.79101 9 10 28.36067 20.32503 14.21002 1 uM Substrate t A B C 0 1 2 3 4 -0.00046 0.004032 0.001354 1.677879 1.188253 0.830636 3.349256 2.367746 1.661381 5.0257433.553623 2.49926 6.705287 4.742268 3.330112 8.380131 5.925137 4.160385 10.04934 7.1068934.996904 11.72746 8.296294 5.828664 13.40034 9.478824 6.656827 5 6 7 8 9 15.08315 10.66638 7.487284 16.75608 11.85372 8.319568 10