Answered step by step
Verified Expert Solution
Link Copied!

Question

1 Approved Answer

10. A media website analysed the biased graphs used by a political party in a recent election (on the left) and posted the corrected, more
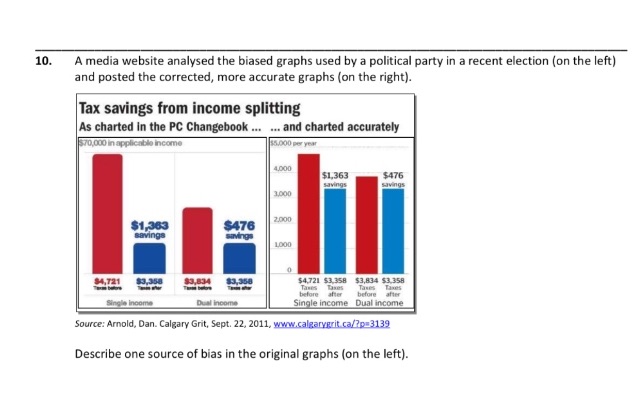
image text in transcribed
10. A media website analysed the biased graphs used by a political party in a recent election (on the left) and posted the corrected, more accurate graphs (on the right). Tax savings from income splitting As charted in the PC Changebook ... ... and charted accurately $70,000 in applicable income $,000 per year 4.000 $1.363 $476 savings savings 3.000 2.000 $1,363 $476 savings LOOD $3.358 $4,721 $3 358 $3,834 53 358 before after before after Single Income Dual Income Single income Dual income Source: Arnold, Dan. Calgary Grit, Sept. 22, 2011, www.calgarygrit.ca/7p 3139 Describe one source of bias in the original graphs (on the left)

Step by Step Solution

There are 3 Steps involved in it

Step: 1

blur-text-image

Get Instant Access to Expert-Tailored Solutions

See step-by-step solutions with expert insights and AI powered tools for academic success

Step: 2

blur-text-image

Step: 3

blur-text-image

Ace Your Homework with AI

Get the answers you need in no time with our AI-driven, step-by-step assistance

Get Started

Recommended Textbook for

Birds Higher Engineering Mathematics

Authors: John Bird

9th Edition

1000353036, 9781000353037

More Books

Students also viewed these Mathematics questions

Question

to encourage a drive for change by developing new ideas;

Answered: 1 week ago

Question

4 What are the alternatives to the competences approach?

Answered: 1 week ago