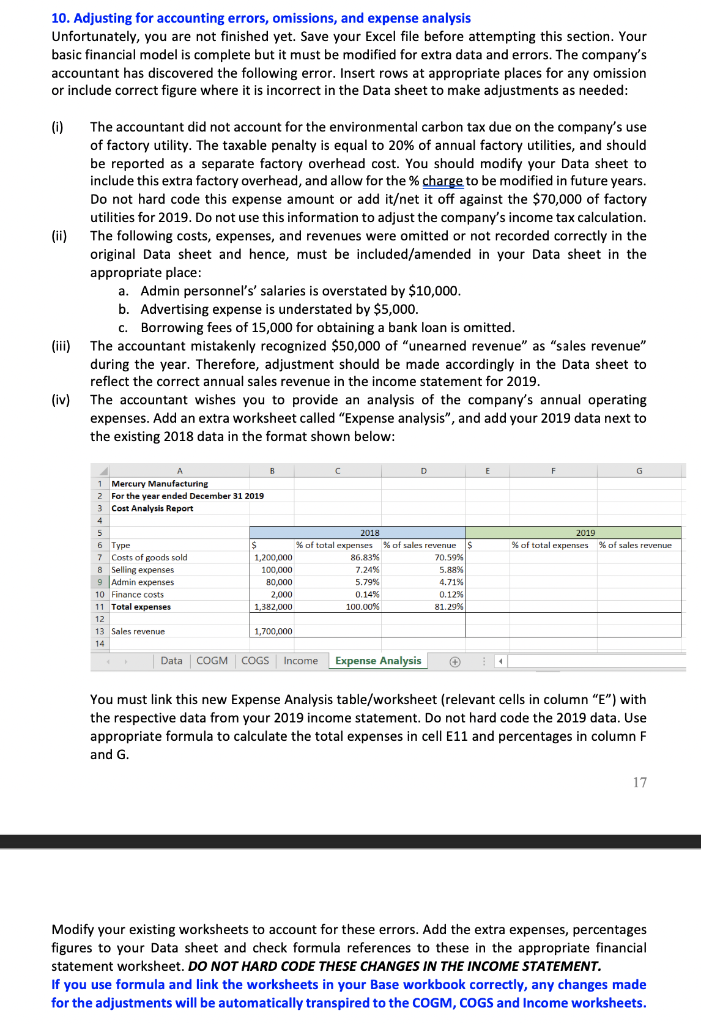
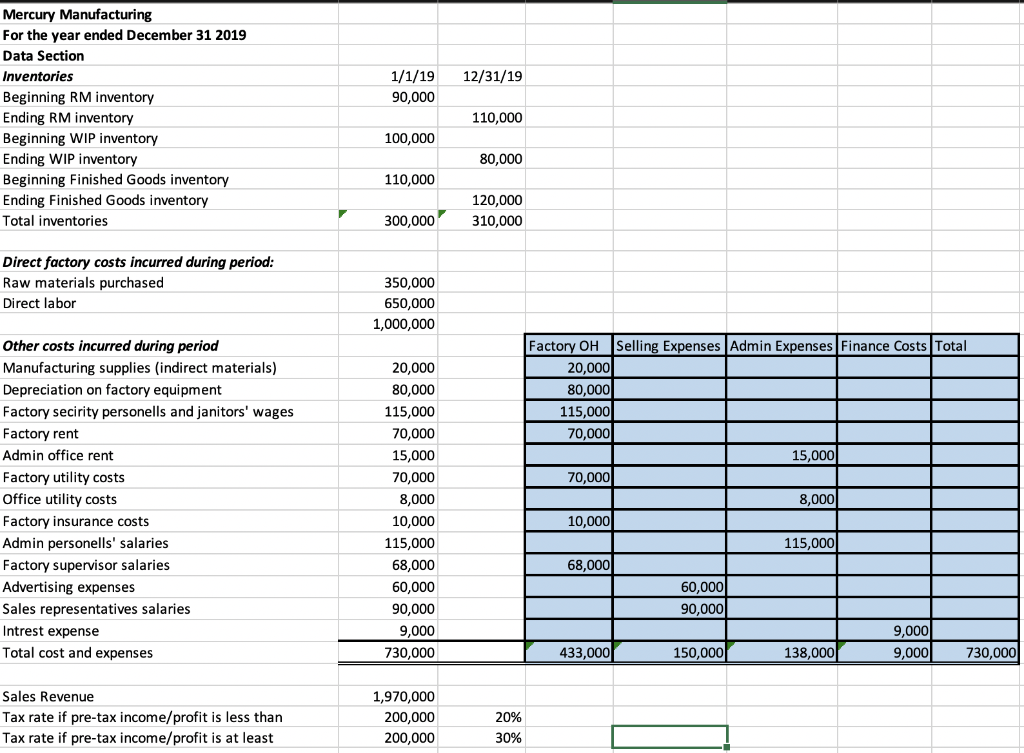
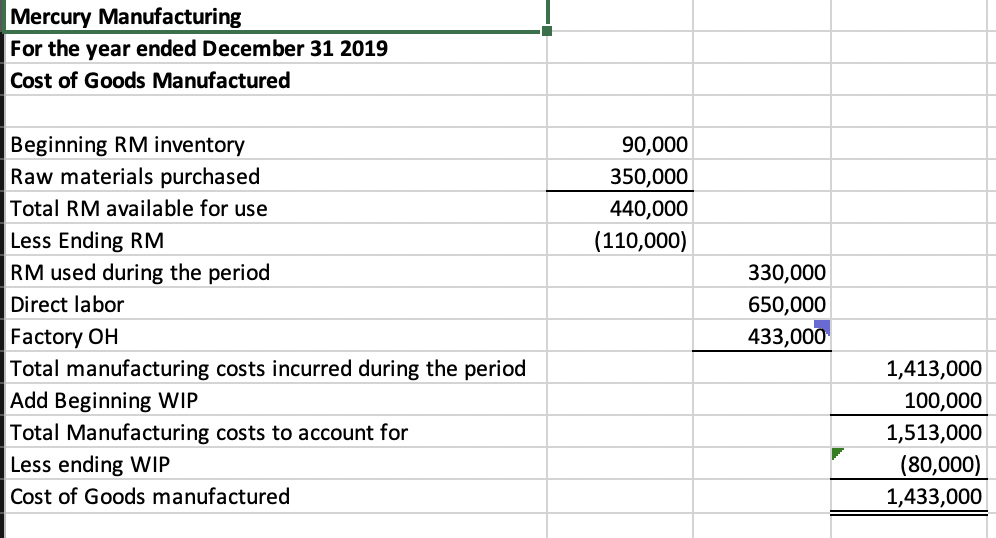
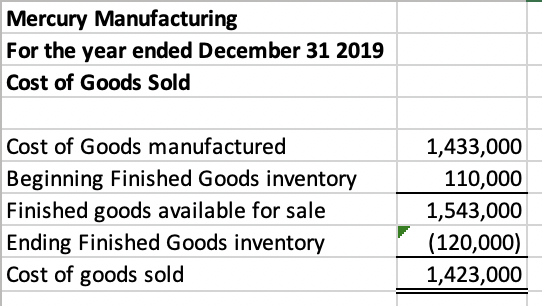
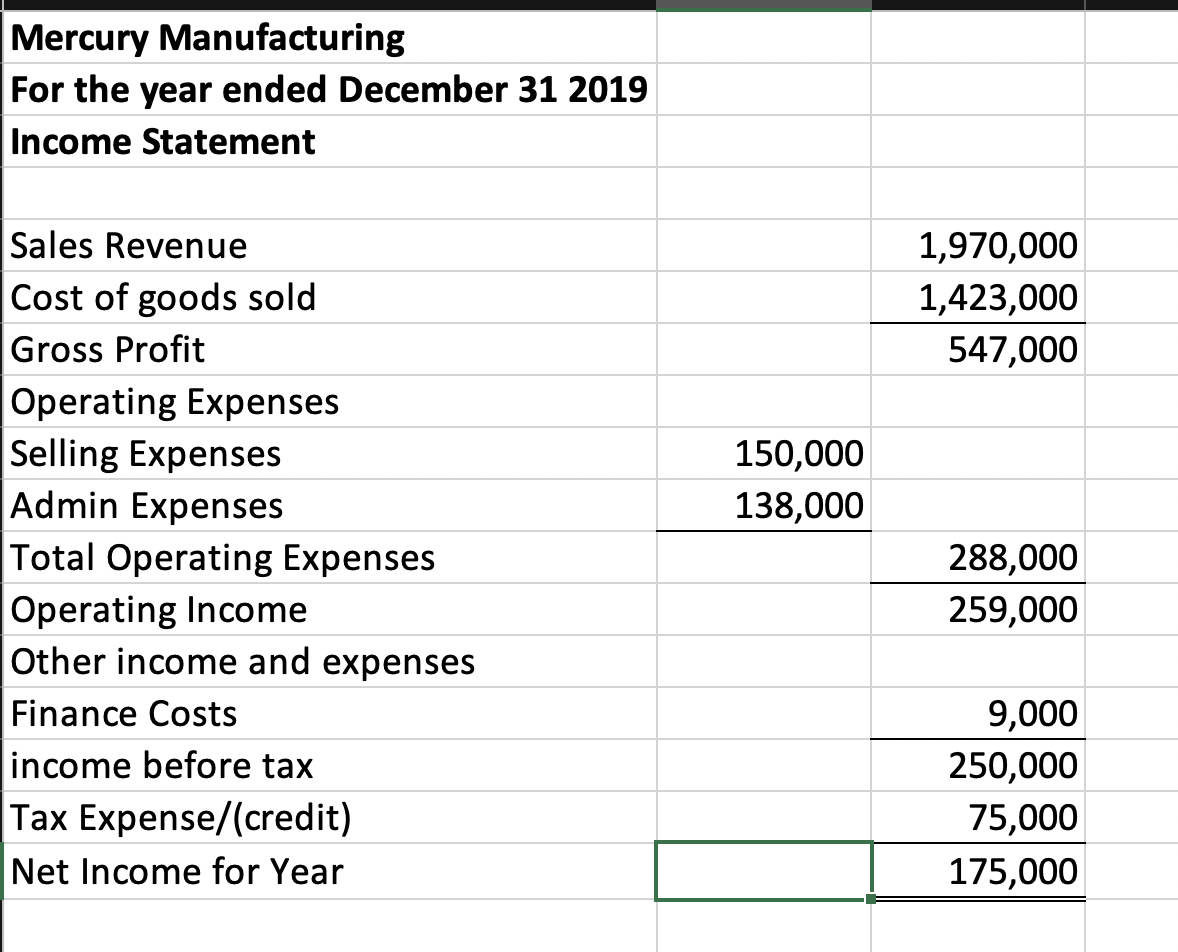
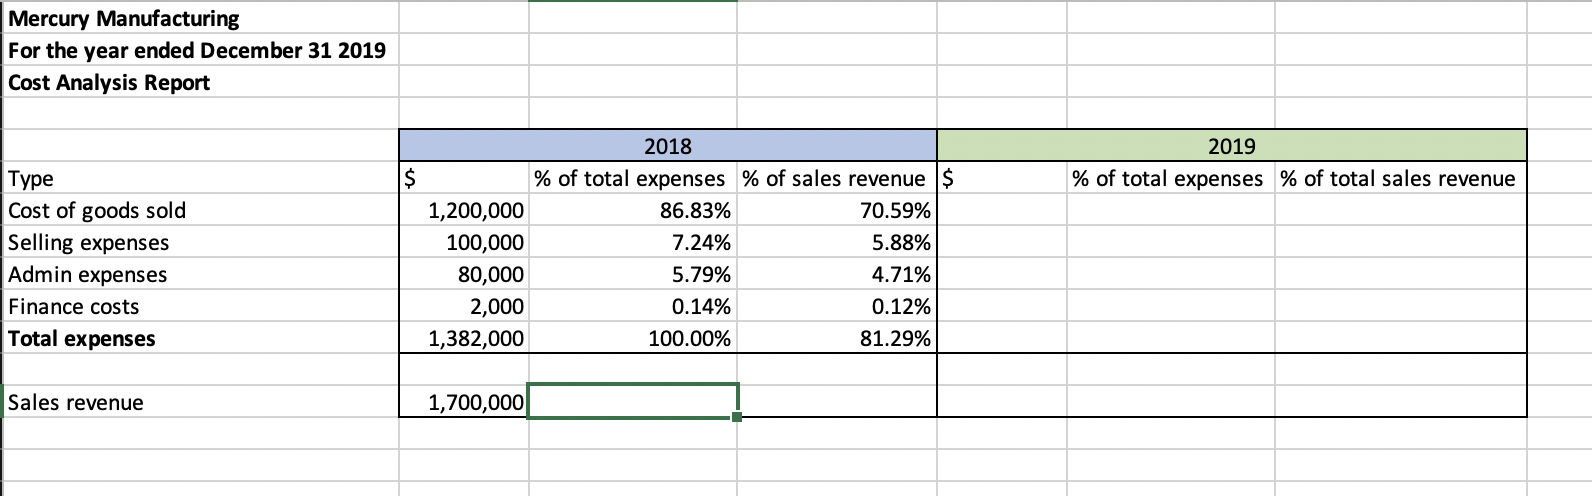
10. Adjusting for accounting errors, omissions, and expense analysis Unfortunately, you are not finished yet. Save your Excel file before attempting this section. Your basic financial model is complete but it must be modified for extra data and errors. The company's accountant has discovered the following error. Insert rows at appropriate places for any omission or include correct figure where it is incorrect in the Data sheet to make adjustments as needed: (i) The accountant did not account for the environmental carbon tax due on the company's use of factory utility. The taxable penalty is equal to 20% of annual factory utilities, and should be reported as a separate factory overhead cost. You should modify your Data sheet to include this extra factory overhead, and allow for the % charge to be modified in future years. Do not hard code this expense amount or add itet it off against the $70,000 of factory utilities for 2019. Do not use this information to adjust the company's income tax calculation. The following costs, expenses, and revenues were omitted or not recorded correctly in the original Data sheet and hence, must be included/amended in your Data sheet in the appropriate place: a. Admin personnel's' salaries is overstated by $10,000. b. Advertising expense is understated by $5,000. C. Borrowing fees of 15,000 for obtaining a bank loan is omitted. The accountant mistakenly recognized $50,000 of "unearned revenue" as "sales revenue" during the year. Therefore, adjustment should be made accordingly in the Data sheet to reflect the correct annual sales revenue in the income statement for 2019. The accountant wishes you to provide an analysis of the company's annual operating expenses. Add an extra worksheet called "Expense analysis", and add your 2019 data next to the existing 2018 data in the format shown below: (iii) F G 1 Mercury Manufacturing 2 For the year ended December 31 2019 3 Cost Analysis Report 2019 % of total expenses $ % of sales revenue 7 Costs of goods sold 8 Selling expenses 9 Admin expenses 10 Finance costs 11 Total expenses 2018 % of total expenses 1,200,000 86,83% 100.000 7.24% 80,000 5.79% 2.000 0.14% 1.382.000 100.00% % of sales revenue 70.5996 5,88% 4.71% 0.1294 81.29% 13 Sales revenue 1,700,000 Data COGM COGS Income Expense Analysis You must link this new Expense Analysis table/worksheet (relevant cells in column "E") with the respective data from your 2019 income statement. Do not hard code the 2019 data. Use appropriate formula to calculate the total expenses in cell E11 and percentages in column F and G. 17 Modify your existing worksheets to account for these errors. Add the extra expenses, percentages figures to your Data sheet and check formula references to these in the appropriate financial statement worksheet. DO NOT HARD CODE THESE CHANGES IN THE INCOME STATEMENT. If you use formula and link the worksheets in your Base workbook correctly, any changes made for the adjustments will be automatically transpired to the COGM, COGS and Income worksheets. Mercury Manufacturing For the year ended December 31 2019 Data Section Inventories Beginning RM inventory Ending RM inventory Beginning WIP inventory Ending WIP inventory Beginning Finished Goods inventory Ending Finished Goods inventory Total inventories 1/1/1912/31/19 90,000 110,000 100,000 80,000 110,000 120,000 300,000 310,000 Direct factory costs incurred during period: Raw materials purchased Direct labor 350,000 650,000 1,000,000 Other costs incurred during period Manufacturing supplies (indirect materials) Depreciation on factory equipment Factory secirity personells and janitors' wages Factory rent Admin office rent Factory utility costs Office utility costs Factory insurance costs Admin personells' salaries Factory supervisor salaries Advertising expenses Sales representatives salaries Intrest expense Total cost and expenses 20,000 80,000 115,000 70,000 15,000 70,000 8,000 10,000 115,000 68,000 60,000 90,000 9,000 730,000 Factory OH Selling Expenses Admin Expenses Finance Costs Total 20,000 80,000 115,000 70,000 15,000 70,000 1 8 ,000 10,000 115,000 68,000 60,000 90,000 9,000 433,000 150,000 138,000 9,000 730,000 Sales Revenue Tax rate if pre-tax income/profit is less than Tax rate if pre-tax income/profit is at least 1,970,000 200,000 200,000 20% 30% Mercury Manufacturing For the year ended December 31 2019 Cost of Goods Manufactured 90,000 350,000 440,000 (110,000) Beginning RM inventory Raw materials purchased Total RM available for use Less Ending RM RM used during the period Direct labor Factory OH Total manufacturing costs incurred during the period Add Beginning WIP Total Manufacturing costs to account for Less ending WIP Cost of Goods manufactured 330,000 650,000 433,000 1,413,000 100,000 1,513,000 (80,000) 1,433,000 Mercury Manufacturing For the year ended December 31 2019 Cost of Goods Sold Cost of Goods manufactured Beginning Finished Goods inventory Finished goods available for sale Ending Finished Goods inventory Cost of goods sold 1,433,000 110,000 1,543,000 (120,000) 1,423,000 Mercury Manufacturing For the year ended December 31 2019 Income Statement 1,970,000 1,423,000 547,000 150,000 138,000 Sales Revenue Cost of goods sold Gross Profit Operating Expenses Selling Expenses Admin Expenses Total Operating Expenses Operating Income Other income and expenses Finance Costs income before tax Tax Expense/(credit) Net Income for Year 288,000 259,000 9,000 250,000 75,000 175,000 Mercury Manufacturing For the year ended December 31 2019 Cost Analysis Report 2019 % of total expenses % of total sales revenue $ Type Cost of goods sold Selling expenses Admin expenses Finance costs Total expenses 1,200,000 100,000 80,000 2,000 1,382,000 2018 % of total expenses % of sales revenue $ 86.83% 70.59% 7.24% 5.88% 5.79% 4.71% 0.14% 0.12% 100.00% 81.29% Sales revenue 1,700,000 10. Adjusting for accounting errors, omissions, and expense analysis Unfortunately, you are not finished yet. Save your Excel file before attempting this section. Your basic financial model is complete but it must be modified for extra data and errors. The company's accountant has discovered the following error. Insert rows at appropriate places for any omission or include correct figure where it is incorrect in the Data sheet to make adjustments as needed: (i) The accountant did not account for the environmental carbon tax due on the company's use of factory utility. The taxable penalty is equal to 20% of annual factory utilities, and should be reported as a separate factory overhead cost. You should modify your Data sheet to include this extra factory overhead, and allow for the % charge to be modified in future years. Do not hard code this expense amount or add itet it off against the $70,000 of factory utilities for 2019. Do not use this information to adjust the company's income tax calculation. The following costs, expenses, and revenues were omitted or not recorded correctly in the original Data sheet and hence, must be included/amended in your Data sheet in the appropriate place: a. Admin personnel's' salaries is overstated by $10,000. b. Advertising expense is understated by $5,000. C. Borrowing fees of 15,000 for obtaining a bank loan is omitted. The accountant mistakenly recognized $50,000 of "unearned revenue" as "sales revenue" during the year. Therefore, adjustment should be made accordingly in the Data sheet to reflect the correct annual sales revenue in the income statement for 2019. The accountant wishes you to provide an analysis of the company's annual operating expenses. Add an extra worksheet called "Expense analysis", and add your 2019 data next to the existing 2018 data in the format shown below: (iii) F G 1 Mercury Manufacturing 2 For the year ended December 31 2019 3 Cost Analysis Report 2019 % of total expenses $ % of sales revenue 7 Costs of goods sold 8 Selling expenses 9 Admin expenses 10 Finance costs 11 Total expenses 2018 % of total expenses 1,200,000 86,83% 100.000 7.24% 80,000 5.79% 2.000 0.14% 1.382.000 100.00% % of sales revenue 70.5996 5,88% 4.71% 0.1294 81.29% 13 Sales revenue 1,700,000 Data COGM COGS Income Expense Analysis You must link this new Expense Analysis table/worksheet (relevant cells in column "E") with the respective data from your 2019 income statement. Do not hard code the 2019 data. Use appropriate formula to calculate the total expenses in cell E11 and percentages in column F and G. 17 Modify your existing worksheets to account for these errors. Add the extra expenses, percentages figures to your Data sheet and check formula references to these in the appropriate financial statement worksheet. DO NOT HARD CODE THESE CHANGES IN THE INCOME STATEMENT. If you use formula and link the worksheets in your Base workbook correctly, any changes made for the adjustments will be automatically transpired to the COGM, COGS and Income worksheets. Mercury Manufacturing For the year ended December 31 2019 Data Section Inventories Beginning RM inventory Ending RM inventory Beginning WIP inventory Ending WIP inventory Beginning Finished Goods inventory Ending Finished Goods inventory Total inventories 1/1/1912/31/19 90,000 110,000 100,000 80,000 110,000 120,000 300,000 310,000 Direct factory costs incurred during period: Raw materials purchased Direct labor 350,000 650,000 1,000,000 Other costs incurred during period Manufacturing supplies (indirect materials) Depreciation on factory equipment Factory secirity personells and janitors' wages Factory rent Admin office rent Factory utility costs Office utility costs Factory insurance costs Admin personells' salaries Factory supervisor salaries Advertising expenses Sales representatives salaries Intrest expense Total cost and expenses 20,000 80,000 115,000 70,000 15,000 70,000 8,000 10,000 115,000 68,000 60,000 90,000 9,000 730,000 Factory OH Selling Expenses Admin Expenses Finance Costs Total 20,000 80,000 115,000 70,000 15,000 70,000 1 8 ,000 10,000 115,000 68,000 60,000 90,000 9,000 433,000 150,000 138,000 9,000 730,000 Sales Revenue Tax rate if pre-tax income/profit is less than Tax rate if pre-tax income/profit is at least 1,970,000 200,000 200,000 20% 30% Mercury Manufacturing For the year ended December 31 2019 Cost of Goods Manufactured 90,000 350,000 440,000 (110,000) Beginning RM inventory Raw materials purchased Total RM available for use Less Ending RM RM used during the period Direct labor Factory OH Total manufacturing costs incurred during the period Add Beginning WIP Total Manufacturing costs to account for Less ending WIP Cost of Goods manufactured 330,000 650,000 433,000 1,413,000 100,000 1,513,000 (80,000) 1,433,000 Mercury Manufacturing For the year ended December 31 2019 Cost of Goods Sold Cost of Goods manufactured Beginning Finished Goods inventory Finished goods available for sale Ending Finished Goods inventory Cost of goods sold 1,433,000 110,000 1,543,000 (120,000) 1,423,000 Mercury Manufacturing For the year ended December 31 2019 Income Statement 1,970,000 1,423,000 547,000 150,000 138,000 Sales Revenue Cost of goods sold Gross Profit Operating Expenses Selling Expenses Admin Expenses Total Operating Expenses Operating Income Other income and expenses Finance Costs income before tax Tax Expense/(credit) Net Income for Year 288,000 259,000 9,000 250,000 75,000 175,000 Mercury Manufacturing For the year ended December 31 2019 Cost Analysis Report 2019 % of total expenses % of total sales revenue $ Type Cost of goods sold Selling expenses Admin expenses Finance costs Total expenses 1,200,000 100,000 80,000 2,000 1,382,000 2018 % of total expenses % of sales revenue $ 86.83% 70.59% 7.24% 5.88% 5.79% 4.71% 0.14% 0.12% 100.00% 81.29% Sales revenue 1,700,000