Question
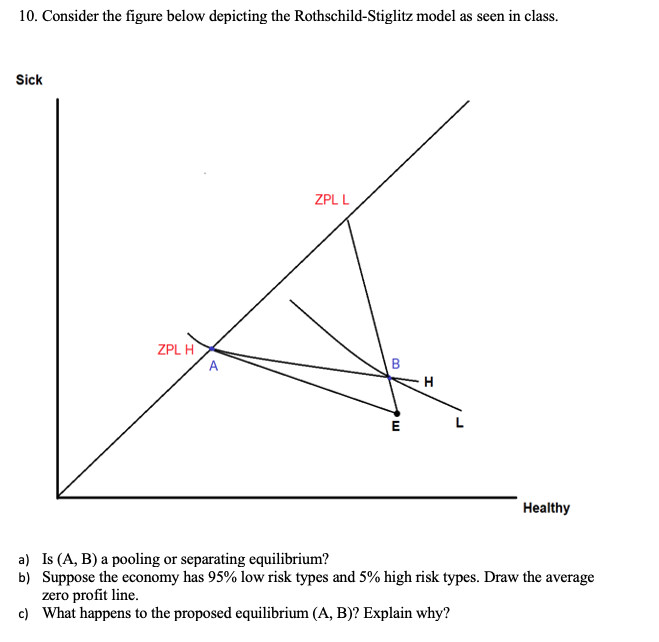
10. Consider the figure below depicting the Rothschild-Stiglitz model as seen in class. Sick ZPL L ZPL H B A H E Healthy a)

10. Consider the figure below depicting the Rothschild-Stiglitz model as seen in class. Sick ZPL L ZPL H B A H E Healthy a) Is (A, B) a pooling or separating equilibrium? b) Suppose the economy has 95% low risk types and 5% high risk types. Draw the average zero profit line. c) What happens to the proposed equilibrium (A, B)? Explain why?
Step by Step Solution
There are 3 Steps involved in it
Step: 1

Get Instant Access to Expert-Tailored Solutions
See step-by-step solutions with expert insights and AI powered tools for academic success
Step: 2

Step: 3

Ace Your Homework with AI
Get the answers you need in no time with our AI-driven, step-by-step assistance
Get StartedRecommended Textbook for
Microeconomics An Intuitive Approach with Calculus
Authors: Thomas Nechyba
1st edition
538453257, 978-0538453257
Students also viewed these Mathematics questions
Question
Answered: 1 week ago
Question
Answered: 1 week ago
Question
Answered: 1 week ago
Question
Answered: 1 week ago
Question
Answered: 1 week ago
Question
Answered: 1 week ago
Question
Answered: 1 week ago
Question
Answered: 1 week ago
Question
Answered: 1 week ago
Question
Answered: 1 week ago
Question
Answered: 1 week ago
Question
Answered: 1 week ago
Question
Answered: 1 week ago
Question
Answered: 1 week ago
Question
Answered: 1 week ago
Question
Answered: 1 week ago
Question
Answered: 1 week ago
Question
Answered: 1 week ago
Question
Answered: 1 week ago
Question
Answered: 1 week ago
Question
Answered: 1 week ago
View Answer in SolutionInn App


