

Question
10 fold plot ROC with many classifers python3.6 I want to apply ROC curve for 10 fold cross validation with two classifier in python. I
10 fold plot ROC with many classifers python3.6
I want to apply ROC curve for 10 fold cross validation with two classifier in python.
I follow some code but I still have trouble to present mean of 10 fold that present two classifier one for decision tree and other for regression
Here is my code: as you know 10 fold will test 10 times I want to present average of 10 times as ROC curve for decision tree and regression
iris= datasets.load_iris()
X,y = iris.data[50:,[1,2]], iris.target[50:]
X_train, X_test,y_train,y_test=\
train_test_split(X,y,test_size=0.5,random_state=1)
#Run classifier with cross-validation and plot ROC curves
cv = StratifiedKFold(n_splits=10)
#classifier = svm.SVC(kernel='linear', probability=True,
classifier1 = DecisionTreeClassifier(max_depth=1,criterion='entropy',random_state=0) #random_state=random_state)
classifier2 = LogisticRegression()
classifier3=[classifier1,classifier2]
mean_tpr = 0.0
mean_fpr = np.linspace(0, 1, 100)
colors = cycle(['cyan', 'indigo'])
lw = 2
i = 0
for (train, test), color,classifier in zip(cv.split(X, y), colors,classifier3):
probas_ = classifier.fit(X[train], y[train]).predict_proba(X[test])
# Compute ROC curve and area the curve
fpr, tpr, thresholds = roc_curve(y[test], probas_[:, 1])
mean_tpr += interp(mean_fpr, fpr, tpr)
mean_tpr[0] = 0.0
roc_auc = auc(fpr, tpr)
plt.plot(fpr, tpr, lw=lw, color=color,
label='ROC fold %d (area = %0.2f)' % (i, roc_auc))
i += 1
plt.plot([0, 1], [0, 1], linestyle='--', lw=lw, color='k',
label='Luck')
mean_tpr /= cv.get_n_splits(X, y)
mean_tpr[-1] = 1.0
mean_auc = auc(mean_fpr, mean_tpr)
plt.plot(mean_fpr, mean_tpr, color='g', linestyle='--',
label='Mean ROC (area = %0.2f)' % mean_auc, lw=lw)
plt.xlim([-0.05, 1.05])
plt.ylim([-0.05, 1.05])
plt.xlabel('False Positive Rate')
plt.ylabel('True Positive Rate')
plt.title('Receiver operating characteristic example')
plt.legend(loc="lower right")
plt.show()
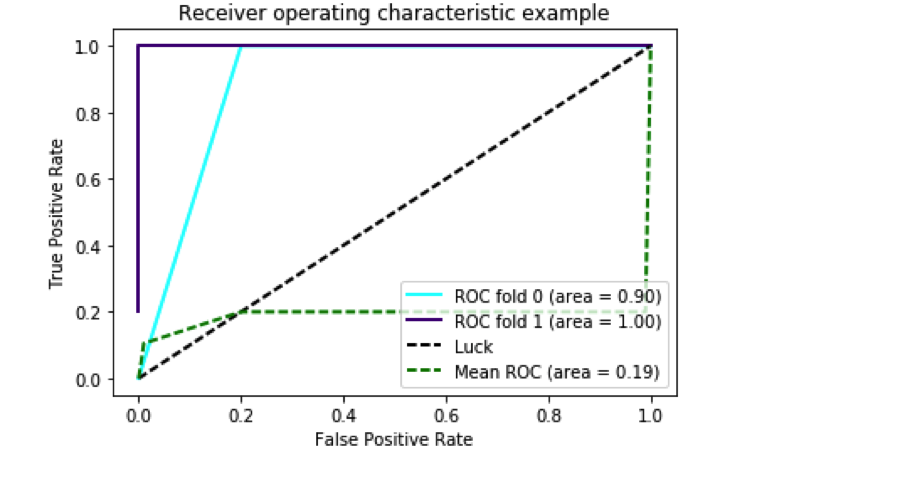
10 r 0.8 0.6 0.4 0.2 0.0 0.0 Receiver operating characteristic example ROC fold 0 (area 0.900 ROC fold 1 (area 1.00) Luck Mean ROC (area 0.190 10 0.2 0.8 0.4 0.6 False Positive Rate
Step by Step Solution
There are 3 Steps involved in it
Step: 1

Get Instant Access to Expert-Tailored Solutions
See step-by-step solutions with expert insights and AI powered tools for academic success
Step: 2

Step: 3
Ace Your Homework with AI
Get the answers you need in no time with our AI-driven, step-by-step assistance
Get Started
Handbook Of Relational Database Design
Authors: Candace C. Fleming, Barbara Von Halle
1st Edition
0201114348, 978-0201114348