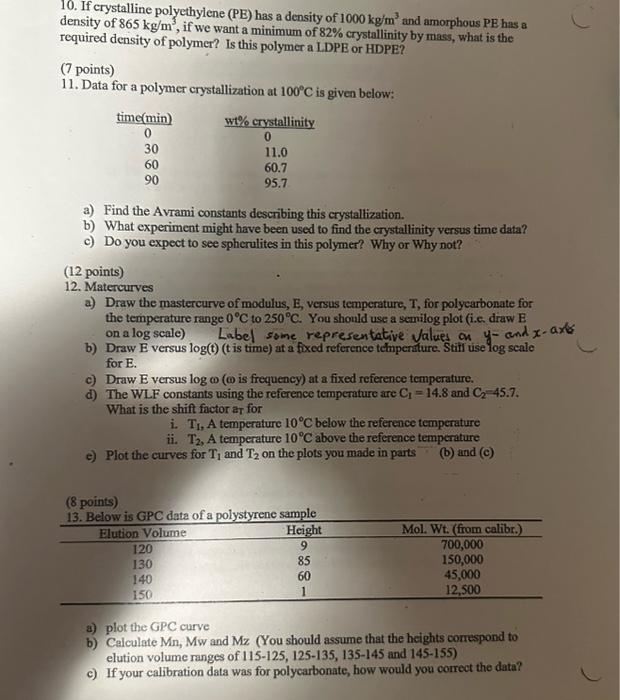
10. If crystalline polyethylene (PE) has a density of 1000kgm3 and amorphous PE has a density of 865kg/m3, if we want a minimum of 82% crystallinity by mass, what is the required density of polymer? Is this polymer a LDPE or HDPE? (7 points) 11. Data for a polymer crystallization at 100C is given below: a) Find the Avrami constants describing this crystallization. b) What experiment might have been used to find the crystallinity versus time data? c) Do you expect to see spherulites in this polymer? Why or Why not? (12 points) 12. Matercurves a) Draw the mastercurve of modulus, E, versus temperature, T, for polycarbonate for the temperature range 0C to 250C. You should use a senvilog plot (i.e. draw E on a log scale) Label some representative values on y - and x-ax b) Draw E versus log(t) ( t is time) at a fixed reference tefnperifure. Stifl ise log seale for B. c) Draw E versus log( is frequency) at a fixed reference temperature. d) The WLF constants using the reference temperature are C1=14.8 and C245.7. What is the shif factor at for i. T1,A temperature 10C below the reference temperature ii. T2,A temperature 10C above the reference temperature e) Plot the curves for T1 and T2 on the plots you made in parts (b) and (c) (8 points) a) plot the GPC curve b) Calculate Mn,Mw and Mz (You should assume that the heights correspond to elution volume ranges of 115-125, 125-135, 135-145 and 145-155) c) If your calibration data was for polycarbonate, how would you correct the data? 10. If crystalline polyethylene (PE) has a density of 1000kgm3 and amorphous PE has a density of 865kg/m3, if we want a minimum of 82% crystallinity by mass, what is the required density of polymer? Is this polymer a LDPE or HDPE? (7 points) 11. Data for a polymer crystallization at 100C is given below: a) Find the Avrami constants describing this crystallization. b) What experiment might have been used to find the crystallinity versus time data? c) Do you expect to see spherulites in this polymer? Why or Why not? (12 points) 12. Matercurves a) Draw the mastercurve of modulus, E, versus temperature, T, for polycarbonate for the temperature range 0C to 250C. You should use a senvilog plot (i.e. draw E on a log scale) Label some representative values on y - and x-ax b) Draw E versus log(t) ( t is time) at a fixed reference tefnperifure. Stifl ise log seale for B. c) Draw E versus log( is frequency) at a fixed reference temperature. d) The WLF constants using the reference temperature are C1=14.8 and C245.7. What is the shif factor at for i. T1,A temperature 10C below the reference temperature ii. T2,A temperature 10C above the reference temperature e) Plot the curves for T1 and T2 on the plots you made in parts (b) and (c) (8 points) a) plot the GPC curve b) Calculate Mn,Mw and Mz (You should assume that the heights correspond to elution volume ranges of 115-125, 125-135, 135-145 and 145-155) c) If your calibration data was for polycarbonate, how would you correct the data


