

Answered step by step
Verified Expert Solution
Question
1 Approved Answer
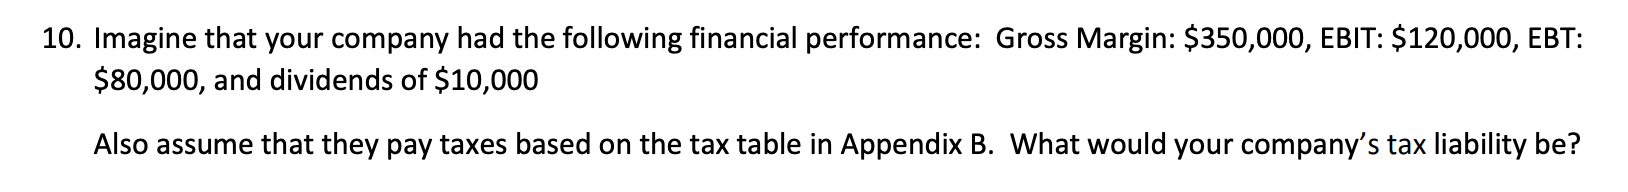
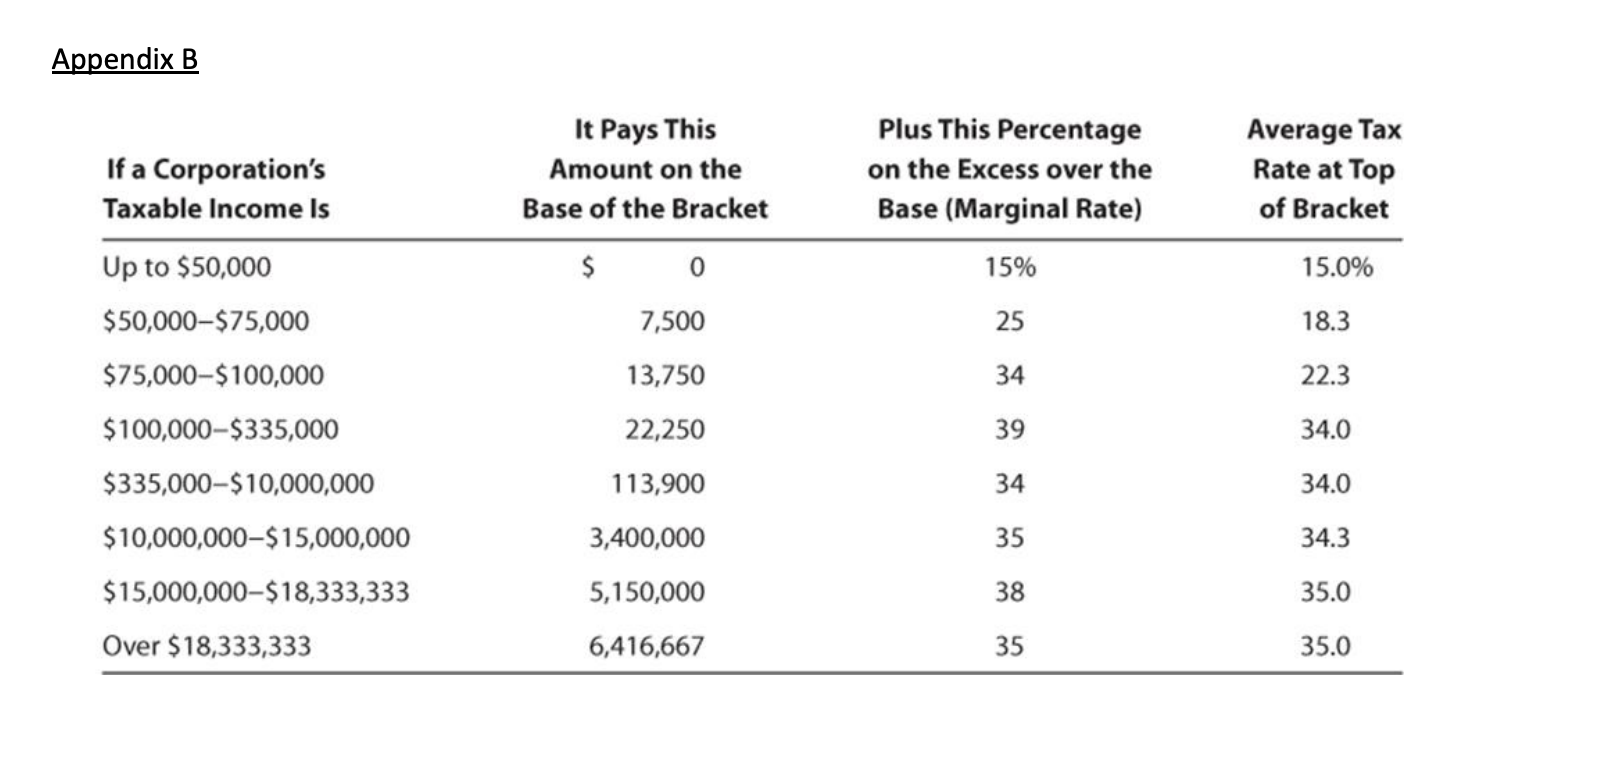
10. Imagine that your company had the following financial performance: Gross Margin: $350,000, EBIT: $120,000, EBT: $80,000, and dividends of $10,000 Also assume that they
Step by Step Solution
There are 3 Steps involved in it
Step: 1

Get Instant Access to Expert-Tailored Solutions
See step-by-step solutions with expert insights and AI powered tools for academic success
Step: 2

Step: 3
Ace Your Homework with AI
Get the answers you need in no time with our AI-driven, step-by-step assistance
Get Started
Financial Markets And Institutions
Authors: Jeff Madura
6th Edition
0324162618, 978-0324162615