

Answered step by step
Verified Expert Solution
Question
1 Approved Answer
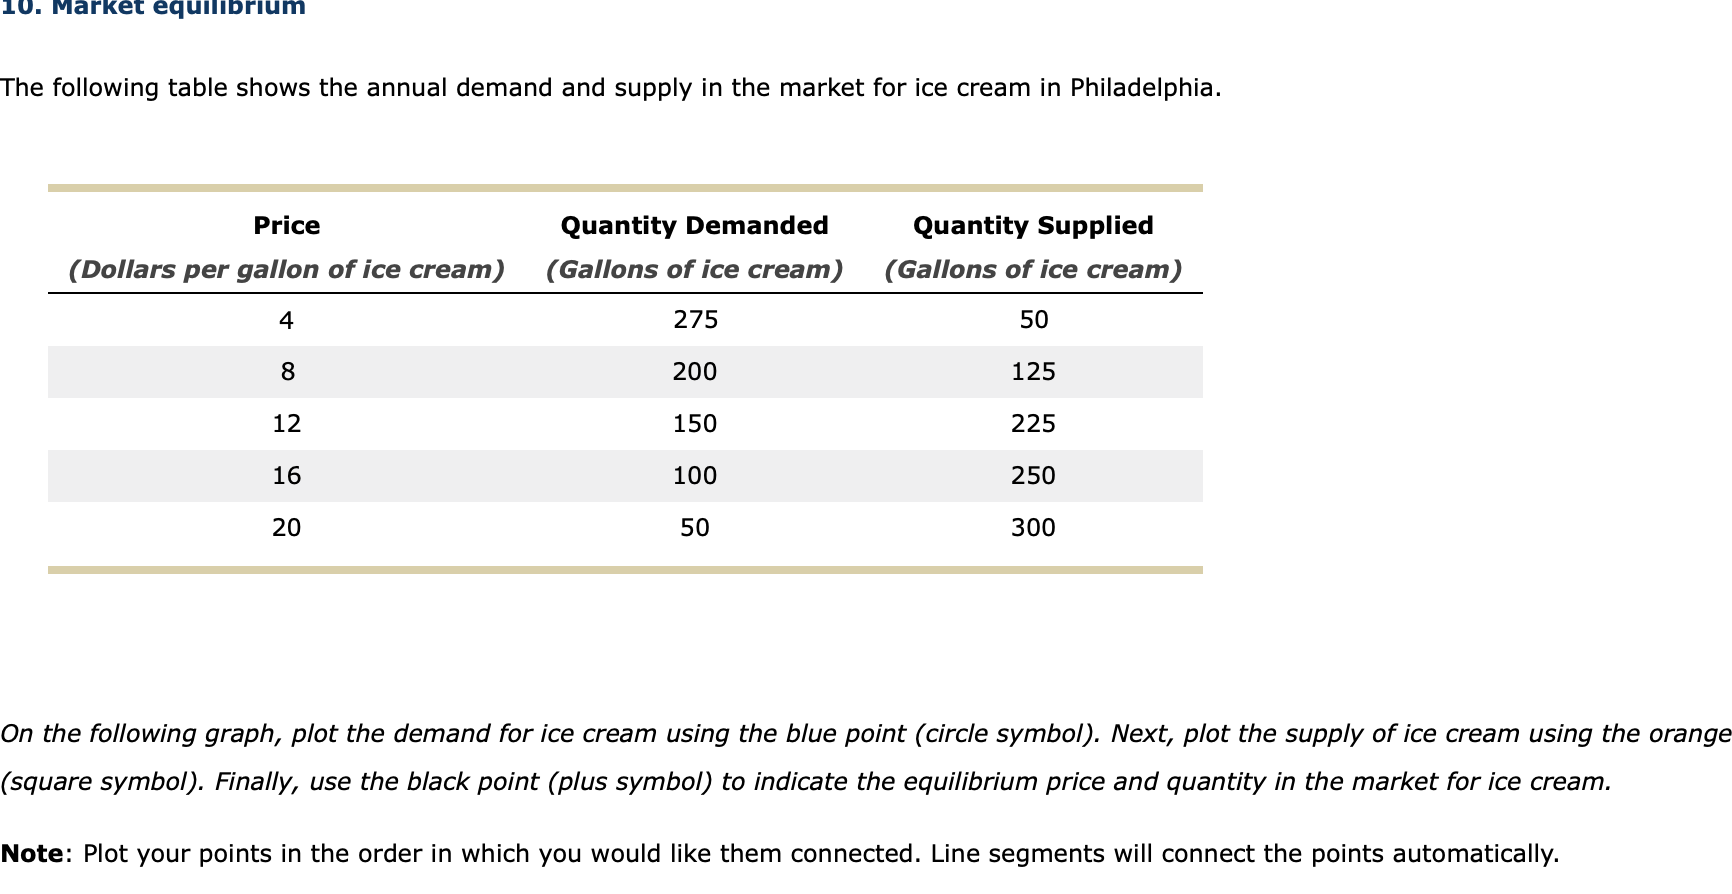
10. Market quilibrium The following table shows the annual demand and supply in the market for ice cream in Philadelphia. Price Quantity Demanded (Gallons of
Step by Step Solution
There are 3 Steps involved in it
Step: 1

Get Instant Access to Expert-Tailored Solutions
See step-by-step solutions with expert insights and AI powered tools for academic success
Step: 2

Step: 3
Ace Your Homework with AI
Get the answers you need in no time with our AI-driven, step-by-step assistance
Get Started
Performance Audit A Case Study Of Indian Metro Railway Metropolitan Transport Project
Authors: Nilay Saha
1st Edition
3846510556, 978-3846510551