Answered step by step
Verified Expert Solution
Question
1 Approved Answer
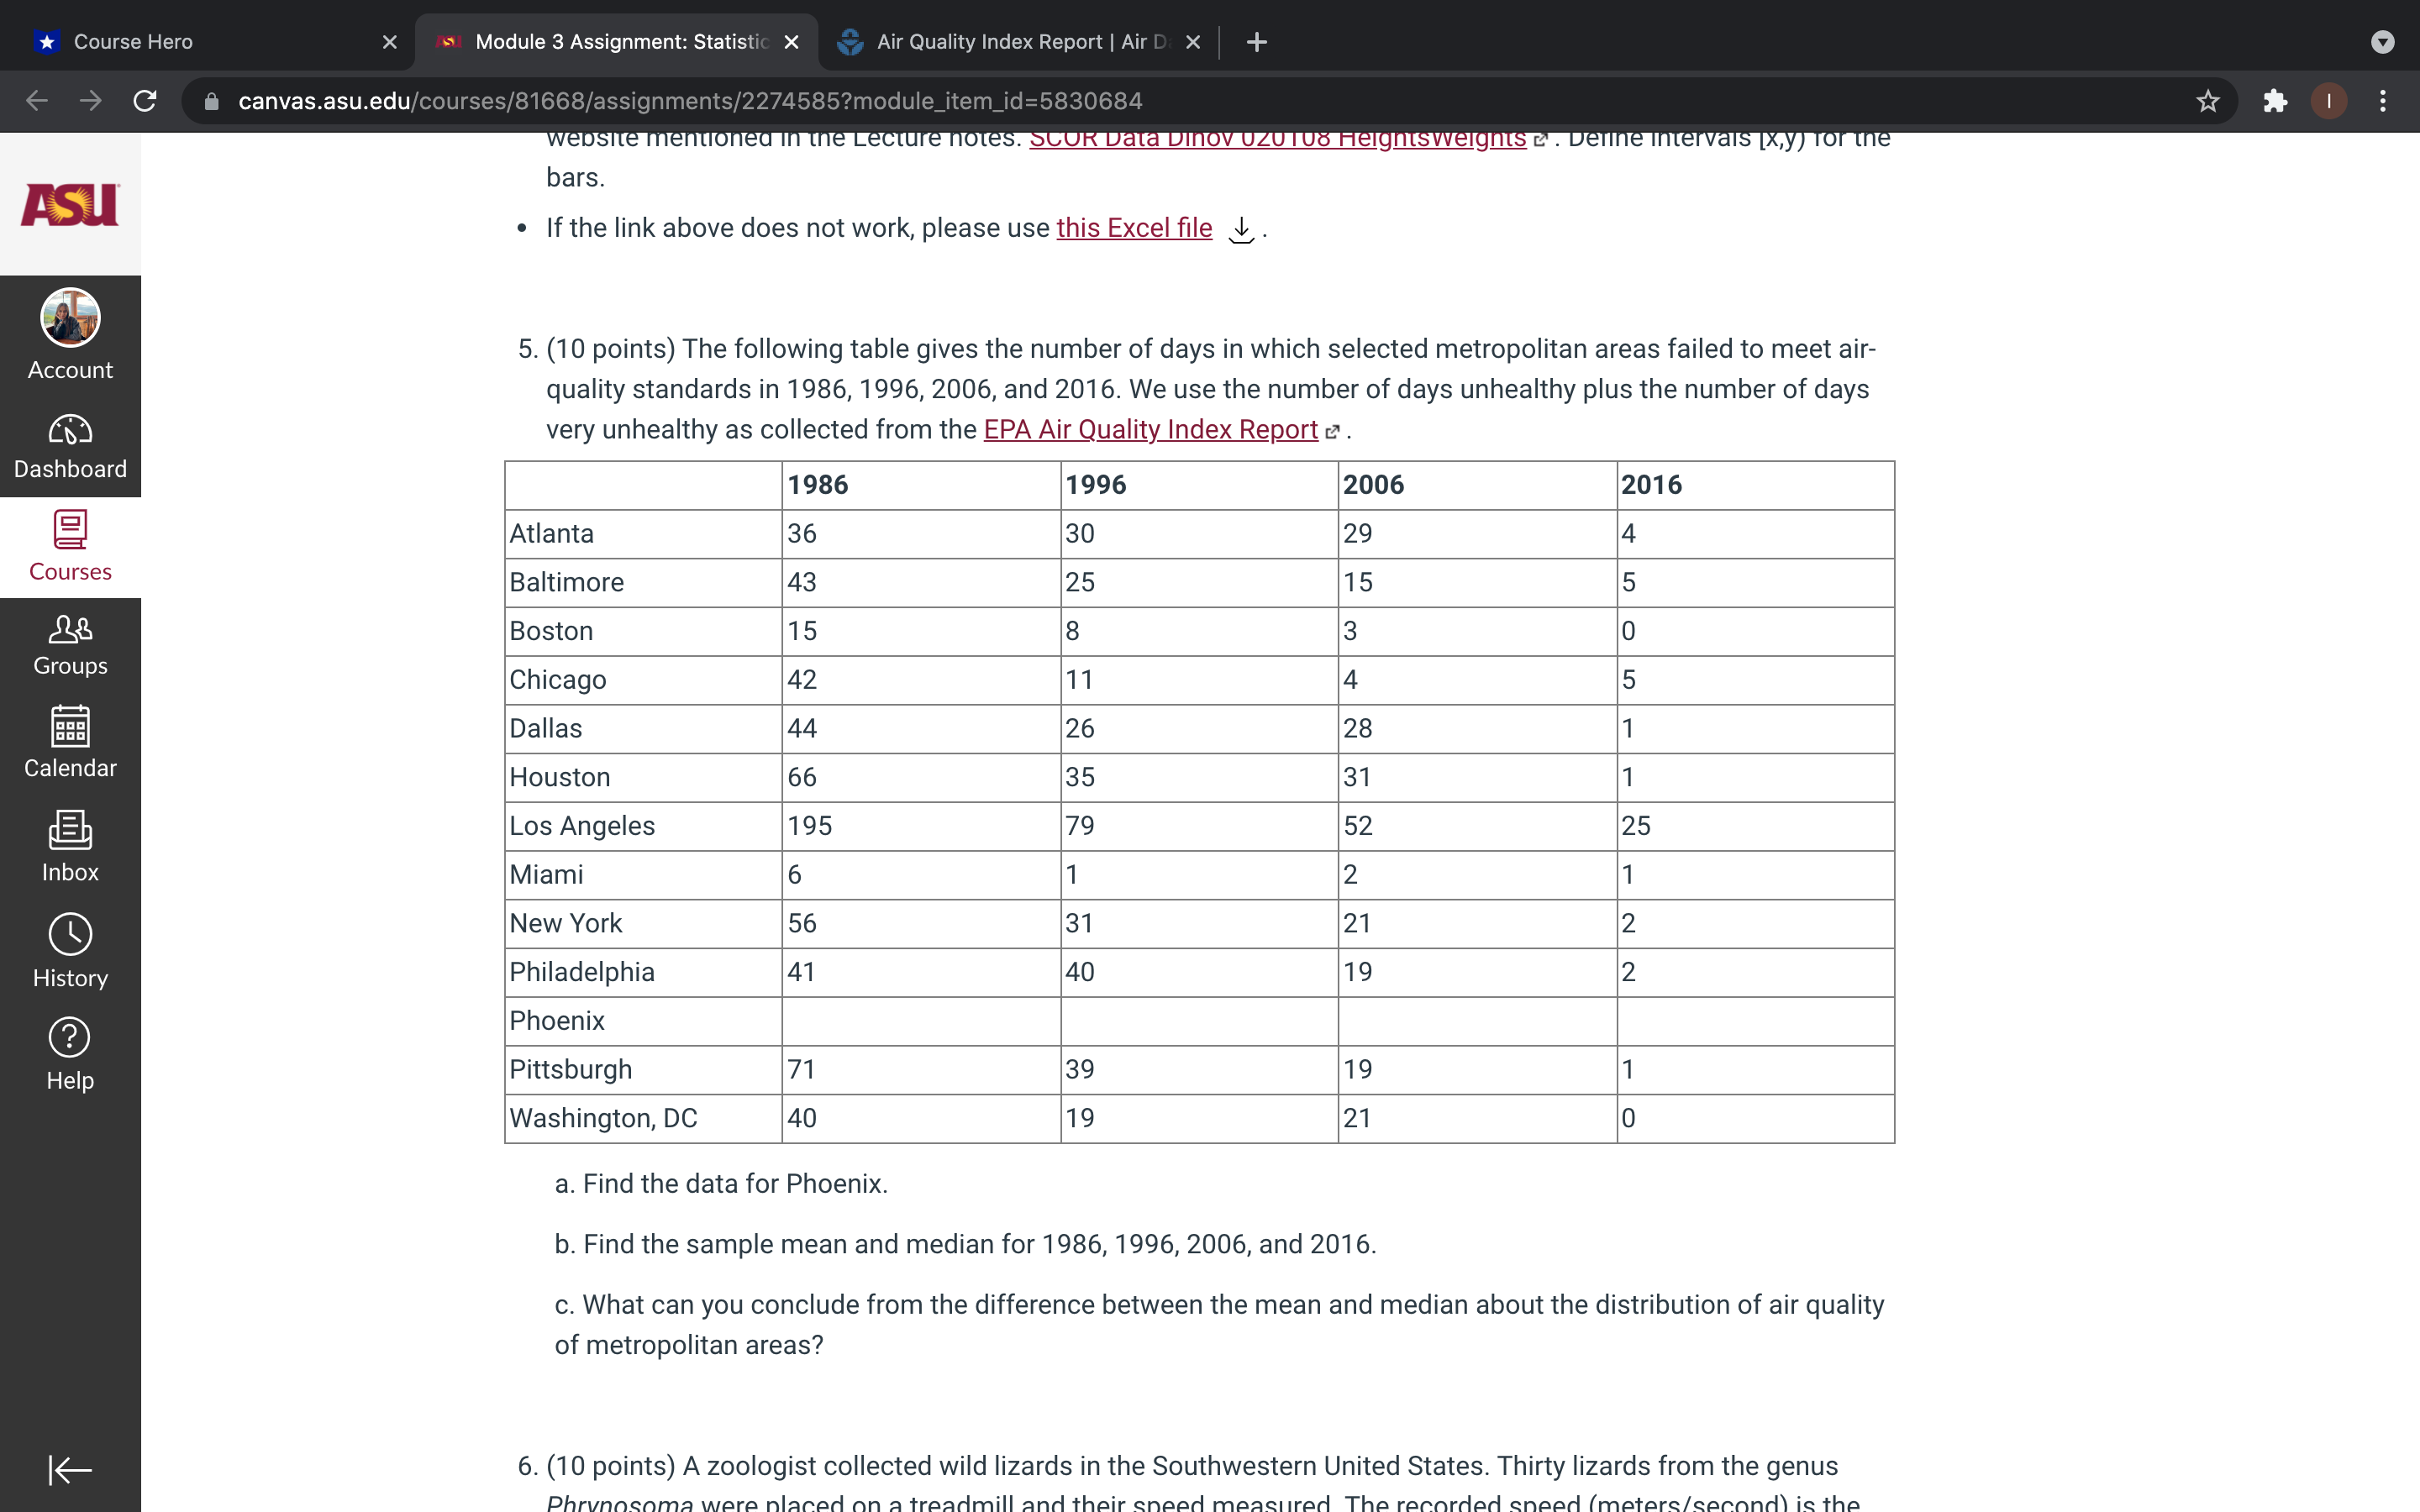
(10 points) The following table gives the number of days in which selected metropolitan areas failed to meet air-quality standards in 1986, 1996, 2006, and
- (10 points) The following table gives the number of days in which selected metropolitan areas failed to meet air-quality standards in 1986, 1996, 2006, and 2016. We use the number of days unhealthy plus the number of days very unhealthy as collected from theEPA Air Quality Index Report(Links to an external site.)
https://www.epa.gov/outdoor-air-quality-data/air-quality-index-report

Step by Step Solution
There are 3 Steps involved in it
Step: 1

Get Instant Access to Expert-Tailored Solutions
See step-by-step solutions with expert insights and AI powered tools for academic success
Step: 2

Step: 3

Ace Your Homework with AI
Get the answers you need in no time with our AI-driven, step-by-step assistance
Get Started


