

Answered step by step
Verified Expert Solution
Question
1 Approved Answer
10. Pozdena and Merewitz (1978) analysed 11 rapid rail transit properties operating in North America between 1960 and 1970. From their analysis, they obtained
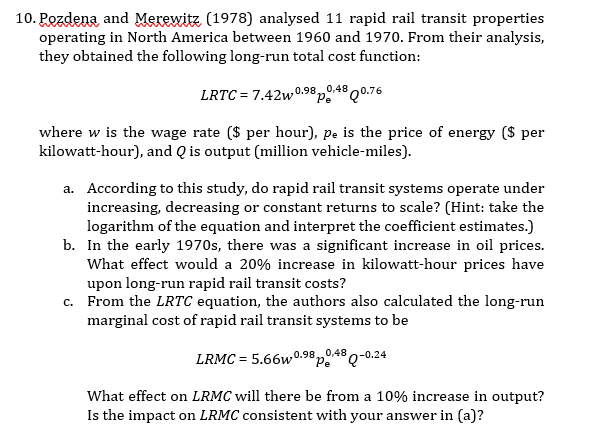
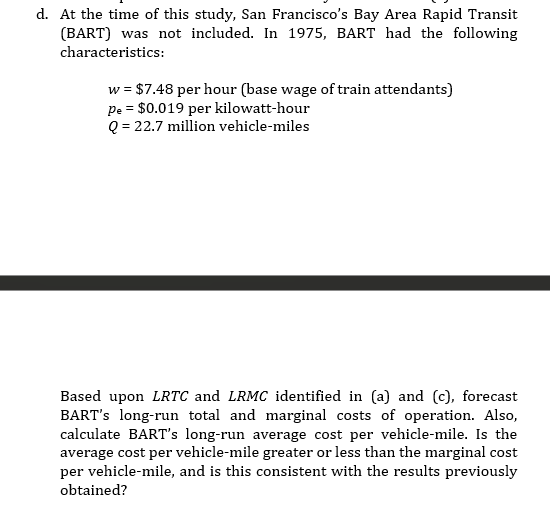
10. Pozdena and Merewitz (1978) analysed 11 rapid rail transit properties operating in North America between 1960 and 1970. From their analysis, they obtained the following long-run total cost function: LRTC= 7.42w0.98 0.98 0.48Q0.76 Pe where w is the wage rate ($ per hour), pe is the price of energy ($ per kilowatt-hour), and Q is output (million vehicle-miles). a. According to this study, do rapid rail transit systems operate under increasing, decreasing or constant returns to scale? (Hint: take the logarithm of the equation and interpret the coefficient estimates.) b. In the early 1970s, there was a significant increase in oil prices. What effect would a 20% increase in kilowatt-hour prices have upon long-run rapid rail transit costs? c. From the LRTC equation, the authors also calculated the long-run marginal cost of rapid rail transit systems to be 0.48-0.24 LRMC = 5.66w0.98 0.48 Q-0.24 What effect on LRMC will there be from a 10% increase in output? Is the impact on LRMC consistent with your answer in (a)? d. At the time of this study, San Francisco's Bay Area Rapid Transit (BART) was not included. In 1975, BART had the following characteristics: w = $7.48 per hour (base wage of train attendants) pe $0.019 per kilowatt-hour Q=22.7 million vehicle-miles Based upon LRTC and LRMC identified in (a) and (c), forecast BART's long-run total and marginal costs of operation. Also, calculate BART's long-run average cost per vehicle-mile. Is the average cost per vehicle-mile greater or less than the marginal cost per vehicle-mile, and is this consistent with the results previously obtained?
Step by Step Solution
There are 3 Steps involved in it
Step: 1

Get Instant Access to Expert-Tailored Solutions
See step-by-step solutions with expert insights and AI powered tools for academic success
Step: 2

Step: 3
Ace Your Homework with AI
Get the answers you need in no time with our AI-driven, step-by-step assistance
Get Started
An Introduction To Statistical Methods And Data Analysis
Authors: R. Lyman Ott, Micheal T. Longnecker
7th Edition
1305269470, 978-1305465527, 1305465520, 978-1305269477