

Answered step by step
Verified Expert Solution
Question
1 Approved Answer
10. Sketch, on the same diagram, graphs of the total revenue and total cost functions, TR -20+140 TC= 20 + 10 (1) Use your
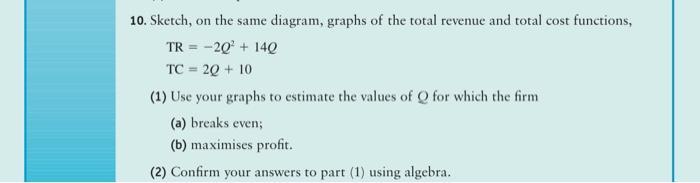
10. Sketch, on the same diagram, graphs of the total revenue and total cost functions, TR -20+140 TC= 20 + 10 (1) Use your graphs to estimate the values of Q for which the firm (a) breaks even; (b) maximises profit. (2) Confirm your answers to part (1) using algebra.
Step by Step Solution
There are 3 Steps involved in it
Step: 1

Get Instant Access to Expert-Tailored Solutions
See step-by-step solutions with expert insights and AI powered tools for academic success
Step: 2

Step: 3
Ace Your Homework with AI
Get the answers you need in no time with our AI-driven, step-by-step assistance
Get Started
Econometric Analysis
Authors: William H. Greene
5th Edition
130661899, 978-0130661890