

Answered step by step
Verified Expert Solution
Question
1 Approved Answer
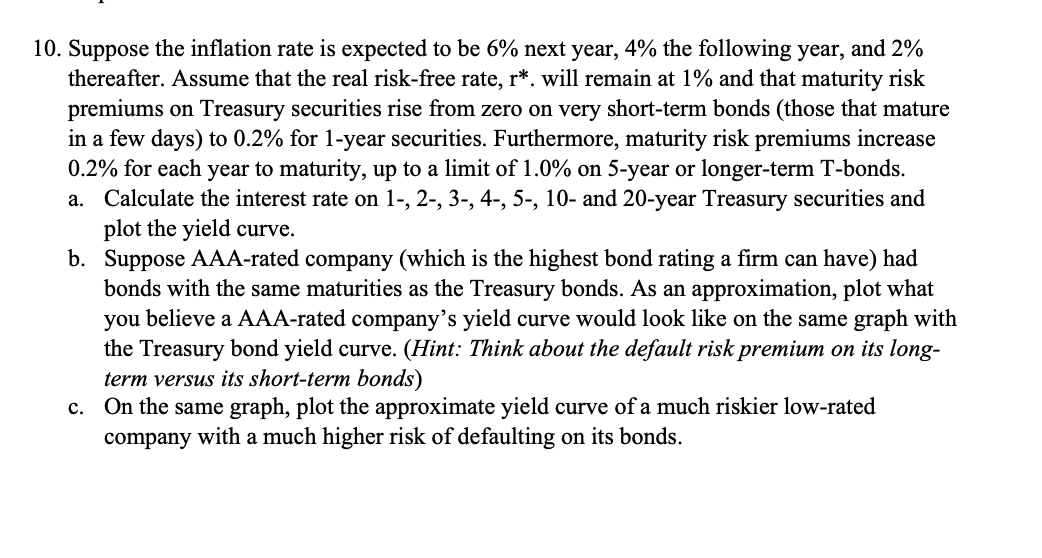
10. Suppose the inflation rate is expected to be 6% next year, 4% the following year, and 2% thereafter. Assume that the real risk-free rate,
Step by Step Solution
There are 3 Steps involved in it
Step: 1

Get Instant Access to Expert-Tailored Solutions
See step-by-step solutions with expert insights and AI powered tools for academic success
Step: 2

Step: 3
Ace Your Homework with AI
Get the answers you need in no time with our AI-driven, step-by-step assistance
Get Started
Essential Personal Finance A Practical Guide For Students
Authors: Lien Luu, Jonquil Lowe, Jason Butler, Tony Byrne
1st Edition
1138692956, 978-1138692954