Answered step by step
Verified Expert Solution
Link Copied!

Question

1 Approved Answer

10) The table below shows the legal costs and the profits of a company from 2000 to 2005. Construct a 10) scatter diagram for the
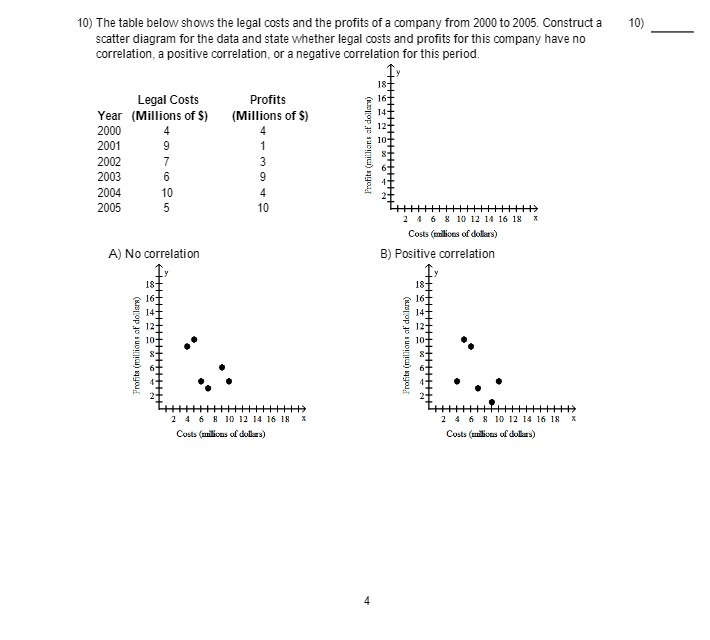
image text in transcribed
10) The table below shows the legal costs and the profits of a company from 2000 to 2005. Construct a 10) scatter diagram for the data and state whether legal costs and profits for this company have no correlation, a positive correlation, or a negative correlation for this period. 181 Legal Costs Profits 16+ Year (Millions of $) (Millions of $) 14+ 2000 4 12+ 2001 9 10- Profits (millions of dollars) 2002 7 to W 2003 2004 10 4 2005 10 THHHHHHHHHA 4 6 8 10 12 14 16 18 Costs (arilions of dollars) A) No correlation B) Positive correlation Profits (millions of dollars) Profits (millions of dollars) HHHHHHHH 6 8 10 12 14 16 18 HHHHHHHA 4 6 8 10 12 14 16 18 X Costs (unlions of dollars) Costs (millions of dollars)

Step by Step Solution

There are 3 Steps involved in it

Step: 1

blur-text-image

Get Instant Access to Expert-Tailored Solutions

See step-by-step solutions with expert insights and AI powered tools for academic success

Step: 2

blur-text-image

Step: 3

blur-text-image

Ace Your Homework with AI

Get the answers you need in no time with our AI-driven, step-by-step assistance

Get Started

Recommended Textbook for

Intermediate Accounting

Authors: Donald E. Kieso, Jerry J. Weygandt, And Terry D. Warfield

13th Edition

9780470374948, 470423684, 470374942, 978-0470423684

Students also viewed these Mathematics questions

Question

How buffering can improve performance of a computer system

Answered: 1 week ago