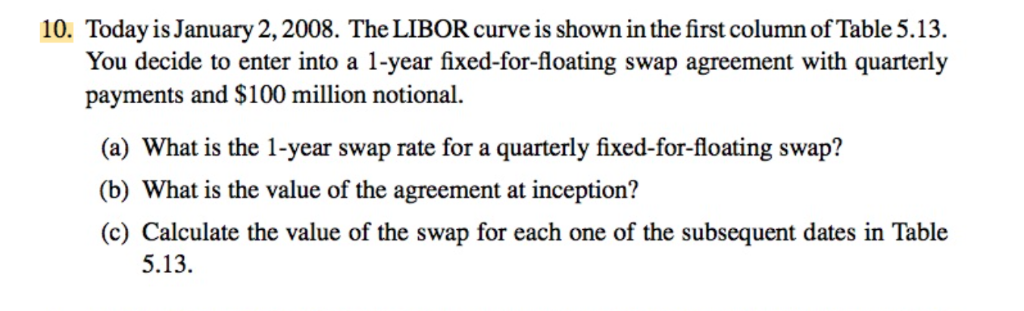
10. Today is January 2,2008. The LIBOR curve is shown in the first column of Table 5.13. You decide to enter into a 1-year fixed-for-floating swap agreement with quarterly payments and $100 million notional. (a) What is the 1-year swap rate for a quarterly fixed-for-floating swap? (b) What is the value of the agreement at inception? (c) Calculate the value of the swap for each one of the subsequent dates in Table 5.13 Table 5.13 The LIBOR Curve: January, 2008 - October, 2008 Months 2-Jan 4.57% 4.64% 4.68% 4.65% 4.61% 4.57% 4.50% 4.42% 4.35% 4.29% 4.24% 4.19% 1-Feb 3.14% 3.11% 3.10% 3.07% 3.05% 3.02% 2.97% 2.92% 2.88% 2.85% 2.83% 2.82% 3-Mar 3.09% 3.04% 3.01% 2.97% 2.91% 2.86% 2.81% 2.76% 2.71% 2.68% 2.65% 2.63% 1-Apr 2.70% 2.69% 2.68% 2.65% 2.64% 2.62% 2.58% 2.54% 2.51% 2.50% 2.48% 2.47% 1-May 2.72% 2.76% 2.78% 2.82% 2.85% 2.88% 2.90% 2.92% 2.93% 2.95% 2.97% 2.98% 2-Jun1-Jul 2.46% 2.46% 2.57% 2.65% 2.68% 2.79% 2.75% 2.89% 2.83% 3.01% 2.90% 3.12% 2.94% 3.15% 2.98% 3.19% 3.02% 3.22% 3.06% 3.25% 3.10% 3.29% 3.14% 3.32% 1-Aug1-Sep 2.46% 2.49% 2.66% 2.68% 2.79% 2.81% 2.89% 2.94% 3.00% 3.02% 3.08% 3.11% 3.10% 3.12% 3.12% 3.14% 3.14% 3.15% 3.17% 3.16% 3.20% 3.18% 3.22% 3.20% 1-Oct 4.00% 4.05% 4.15% 4.09% 4.07% 4.04% 4.04% 4.04% 4.04% 4.04% 4.04% 4.04% 10 12 Source: Bloomberg 10. Today is January 2,2008. The LIBOR curve is shown in the first column of Table 5.13. You decide to enter into a 1-year fixed-for-floating swap agreement with quarterly payments and $100 million notional. (a) What is the 1-year swap rate for a quarterly fixed-for-floating swap? (b) What is the value of the agreement at inception? (c) Calculate the value of the swap for each one of the subsequent dates in Table 5.13 Table 5.13 The LIBOR Curve: January, 2008 - October, 2008 Months 2-Jan 4.57% 4.64% 4.68% 4.65% 4.61% 4.57% 4.50% 4.42% 4.35% 4.29% 4.24% 4.19% 1-Feb 3.14% 3.11% 3.10% 3.07% 3.05% 3.02% 2.97% 2.92% 2.88% 2.85% 2.83% 2.82% 3-Mar 3.09% 3.04% 3.01% 2.97% 2.91% 2.86% 2.81% 2.76% 2.71% 2.68% 2.65% 2.63% 1-Apr 2.70% 2.69% 2.68% 2.65% 2.64% 2.62% 2.58% 2.54% 2.51% 2.50% 2.48% 2.47% 1-May 2.72% 2.76% 2.78% 2.82% 2.85% 2.88% 2.90% 2.92% 2.93% 2.95% 2.97% 2.98% 2-Jun1-Jul 2.46% 2.46% 2.57% 2.65% 2.68% 2.79% 2.75% 2.89% 2.83% 3.01% 2.90% 3.12% 2.94% 3.15% 2.98% 3.19% 3.02% 3.22% 3.06% 3.25% 3.10% 3.29% 3.14% 3.32% 1-Aug1-Sep 2.46% 2.49% 2.66% 2.68% 2.79% 2.81% 2.89% 2.94% 3.00% 3.02% 3.08% 3.11% 3.10% 3.12% 3.12% 3.14% 3.14% 3.15% 3.17% 3.16% 3.20% 3.18% 3.22% 3.20% 1-Oct 4.00% 4.05% 4.15% 4.09% 4.07% 4.04% 4.04% 4.04% 4.04% 4.04% 4.04% 4.04% 10 12 Source: Bloomberg