Answered step by step
Verified Expert Solution
Link Copied!

Question

1 Approved Answer

10) Using the data in the following table: a. Calculate the return for investing in this stock. b. Compute the 95% confidence interval for the
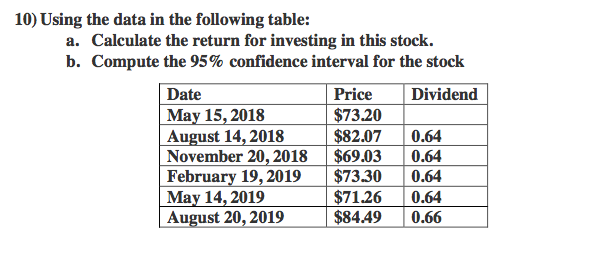
image text in transcribed

10) Using the data in the following table: a. Calculate the return for investing in this stock. b. Compute the 95% confidence interval for the stock Date May 15, 2018 August 14, 2018 November 20, 2018 February 19, 2019 May 14, 2019 August 20, 2019 Price Dividend $73.20 $82.07 0.64 $69.03 0.64 $73.30 0.64 $71.26 0.64 $84.490.66 10) Using the data in the following table: a. Calculate the return for investing in this stock. b. Compute the 95% confidence interval for the stock Date May 15, 2018 August 14, 2018 November 20, 2018 February 19, 2019 May 14, 2019 August 20, 2019 Price Dividend $73.20 $82.07 0.64 $69.03 0.64 $73.30 0.64 $71.26 0.64 $84.490.66

Step by Step Solution

There are 3 Steps involved in it

Step: 1

blur-text-image

Get Instant Access to Expert-Tailored Solutions

See step-by-step solutions with expert insights and AI powered tools for academic success

Step: 2

blur-text-image

Step: 3

blur-text-image

Ace Your Homework with AI

Get the answers you need in no time with our AI-driven, step-by-step assistance

Get Started

Recommended Textbook for

A Handbook Of Mutual Fund Investing

Authors: Barry G Dolgin

1st Edition

1456489704, 978-1456489700

More Books

Students also viewed these Finance questions