Answered step by step
Verified Expert Solution
Question
1 Approved Answer
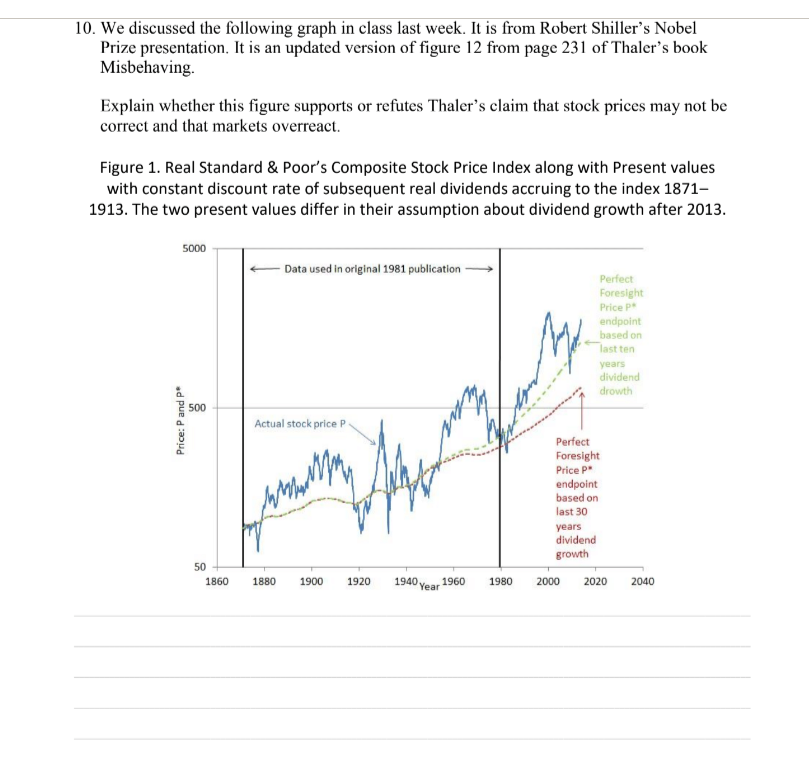
10. We discussed the following graph in class last week. It is from Robert Shiller's Nobel Prize presentation. It is an updated version of figure
Step by Step Solution
There are 3 Steps involved in it
Step: 1

Get Instant Access to Expert-Tailored Solutions
See step-by-step solutions with expert insights and AI powered tools for academic success
Step: 2

Step: 3
Ace Your Homework with AI
Get the answers you need in no time with our AI-driven, step-by-step assistance
Get Started