Answered step by step
Verified Expert Solution
Link Copied!

Question

1 Approved Answer

10. What is the independent variable and what does it represent? 11. What is the dependent variable and what does it represent? 12. Describe the
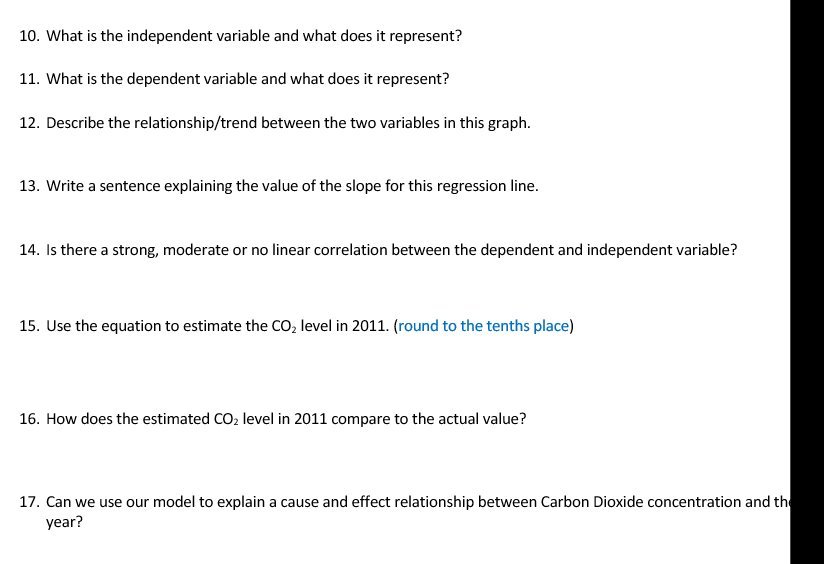
image text in transcribed
10. What is the independent variable and what does it represent? 11. What is the dependent variable and what does it represent? 12. Describe the relationship/trend between the two variables in this graph. 13. Write a sentence explaining the value of the slope for this regression line. 14. Is there a strong, moderate or no linear correlation between the dependent and independent variable? 15. Use the equation to estimate the CO, level in 2011. (round to the tenths place) 16. How does the estimated CO2 level in 2011 compare to the actual value? 17. Can we use our model to explain a cause and effect relationship between Carbon Dioxide concentration and the year

Step by Step Solution

There are 3 Steps involved in it

Step: 1

blur-text-image

Get Instant Access to Expert-Tailored Solutions

See step-by-step solutions with expert insights and AI powered tools for academic success

Step: 2

blur-text-image_2

Step: 3

blur-text-image_3

Ace Your Homework with AI

Get the answers you need in no time with our AI-driven, step-by-step assistance

Get Started

Recommended Textbook for

Derivatives Markets

Authors: Robert McDonald

3rd Edition

978-9332536746, 9789332536746

Students also viewed these Mathematics questions