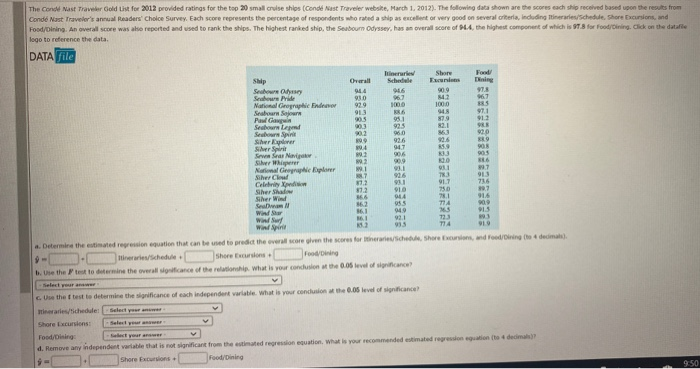
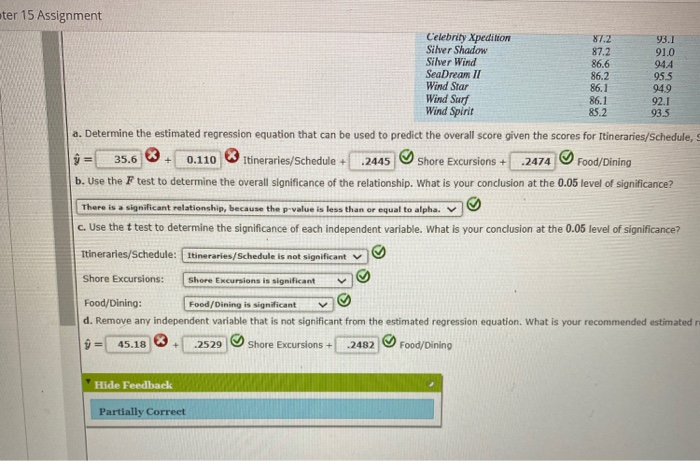
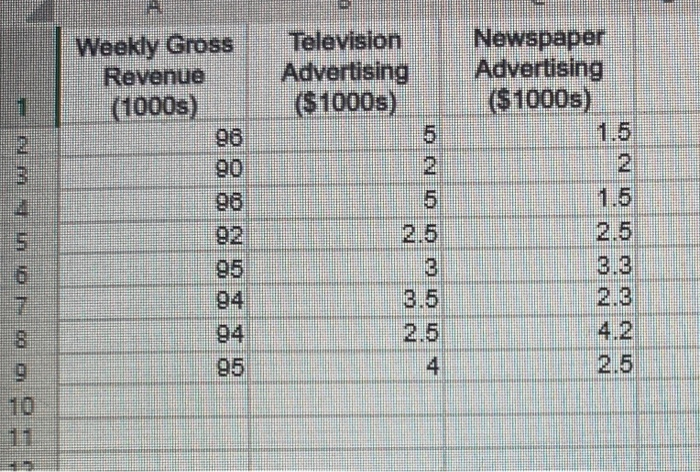
1000 The Cond Nast Traveler Gold List for 2012 provided ratings for the top 20 small cruise ships (Cond Nast Traveler website, March 1, 2012). The following data shown are the scores each ship received based upon the results from Cond Nast Traveler's annual Readers' Choice Survey. Each score represents the percentage of respondents who rated a ship as excellent or very good on several criteria, Induding Tineraries/schedule. Shore Excursions and Food/Dining An overall score was also reported and used to rank the ships. The highest ranked ship, the Seabourn Odyssey, has an overall score of 14, the highest component of which is 97.8 for Food/Dining Click on the detalle logo to reference the data DATA file Terrier Shore Food Ship Overall Schedule Excel Sebore 944 06 909 91.8 Seabour Pride 910 96,7 142 967 National Geographic 929 1000 Seabourn Saw 913 97.1 Paul Gawin 05 95 87.9 912 Seabourn Land 903 9225 RS Seabourne 02 06.0 863 92.0 Sheryer 926 ERO Sierpie 19.4 947 25 Swarov 0.1 3 905 Silwer Where 02 6 National Geographic Explorer 1 93.1 011 27 Sher 926 T3 93 Celebrity Xpedio 1.2 911 917 716 Siher Shade 12 10 750 907 Siher Wind 866 084 78.1 916 Seawam 862 055 TA 90.9 Window 361 049 915 www 921 733 193 Wind Spin T14 919 .. Determine the estimated regression equation that can be used to predict the overall score given the ones for the schedule Shore Excursions and Food/bling to decima 2 Itineraries/schedule Shore Ecursions Fooding 1. Use the best to determine the overall significance of the relationship. What is your conclusion at the 0.05 level of cance? L7 11 Select your c. Use the test to determine the significance of each independent variable. What is your conclusion at the 0.05 level of significance! harles/Schedule Select your Shore Excursions Food/Dining d. Remove any independent variable that is not significant from the estimated regression equation. What is your recommended estimated regression equation to decimal $ Shore Excursions Food/Dining 9:50 eter 15 Assignment Celebrity Xpedition 87.2 93.1 Silver Shadow 87.2 91.0 Silver Wind 86.6 944 SeaDream 11 86.2 955 Wind Star 86.1 949 Wind Surf 86.1 92.1 Wind Spirit 852 93.5 a. Determine the estimated regression equation that can be used to predict the overall score given the scores for Itineraries/Schedule, 9 = 35.6 0.110 Itineraries/Schedule + .2445 Shore Excursions + .2474 Food/Dining | b. Use the F test to determine the overall significance of the relationship. What is your conclusion at the 0.05 level of significance? There is a significant relationship, because the p value is less than or equal to alpha c. Use the t test to determine the significance of each independent variable. What is your conclusion at the 0.05 level of significance? Itineraries/Schedule: Itineraries/Schedule is not significant Shore Excursions: Shore Excursions is significant Food/Dining: Food/Dining is significant d. Remove any independent variable that is not significant from the estimated regression equation. What is your recommended estimated = Shore Excursions + .2482 Food/Dining 45.18 .2529 Hide Feedback Partially Correct The owner of Showtime Movie Theaters, Inc., would like to predict Weekly gross revenue as a function of advertising expenditures. Historical data for a sample of eight was arred into the Microcal Online file below. the XL Miner Analysis ToolPak to perform your regression analysis in the designated areas of the spreadsheet Open spreadsheet a. Develop an estimated regression equation with the amount of television advertising the independent variable (to 2 decimals) Revenue - 21407 753 TVA b. Develop an estimated regression equation with both television advertising and newspaper advertising as the independent variables to 2 decimals) Revenue TWAY News c. Is the estimated repression equation coefficient for television advertising expenditures the same in part(a) and in part d. Predict weekly gross revenue for a week when 54 thousand is spent on television advertising and $3.9 thousand is spent on newspaper advertising to decim in thousands Weekly Gross Revenue (1000s) Television Advertising ($1000s) Newspaper Advertising ($1000s) 1 06 2 9. ON n o 9 met 6 3.3 2.3 rung 94 94 95 2.5 1000 The Cond Nast Traveler Gold List for 2012 provided ratings for the top 20 small cruise ships (Cond Nast Traveler website, March 1, 2012). The following data shown are the scores each ship received based upon the results from Cond Nast Traveler's annual Readers' Choice Survey. Each score represents the percentage of respondents who rated a ship as excellent or very good on several criteria, Induding Tineraries/schedule. Shore Excursions and Food/Dining An overall score was also reported and used to rank the ships. The highest ranked ship, the Seabourn Odyssey, has an overall score of 14, the highest component of which is 97.8 for Food/Dining Click on the detalle logo to reference the data DATA file Terrier Shore Food Ship Overall Schedule Excel Sebore 944 06 909 91.8 Seabour Pride 910 96,7 142 967 National Geographic 929 1000 Seabourn Saw 913 97.1 Paul Gawin 05 95 87.9 912 Seabourn Land 903 9225 RS Seabourne 02 06.0 863 92.0 Sheryer 926 ERO Sierpie 19.4 947 25 Swarov 0.1 3 905 Silwer Where 02 6 National Geographic Explorer 1 93.1 011 27 Sher 926 T3 93 Celebrity Xpedio 1.2 911 917 716 Siher Shade 12 10 750 907 Siher Wind 866 084 78.1 916 Seawam 862 055 TA 90.9 Window 361 049 915 www 921 733 193 Wind Spin T14 919 .. Determine the estimated regression equation that can be used to predict the overall score given the ones for the schedule Shore Excursions and Food/bling to decima 2 Itineraries/schedule Shore Ecursions Fooding 1. Use the best to determine the overall significance of the relationship. What is your conclusion at the 0.05 level of cance? L7 11 Select your c. Use the test to determine the significance of each independent variable. What is your conclusion at the 0.05 level of significance! harles/Schedule Select your Shore Excursions Food/Dining d. Remove any independent variable that is not significant from the estimated regression equation. What is your recommended estimated regression equation to decimal $ Shore Excursions Food/Dining 9:50 eter 15 Assignment Celebrity Xpedition 87.2 93.1 Silver Shadow 87.2 91.0 Silver Wind 86.6 944 SeaDream 11 86.2 955 Wind Star 86.1 949 Wind Surf 86.1 92.1 Wind Spirit 852 93.5 a. Determine the estimated regression equation that can be used to predict the overall score given the scores for Itineraries/Schedule, 9 = 35.6 0.110 Itineraries/Schedule + .2445 Shore Excursions + .2474 Food/Dining | b. Use the F test to determine the overall significance of the relationship. What is your conclusion at the 0.05 level of significance? There is a significant relationship, because the p value is less than or equal to alpha c. Use the t test to determine the significance of each independent variable. What is your conclusion at the 0.05 level of significance? Itineraries/Schedule: Itineraries/Schedule is not significant Shore Excursions: Shore Excursions is significant Food/Dining: Food/Dining is significant d. Remove any independent variable that is not significant from the estimated regression equation. What is your recommended estimated = Shore Excursions + .2482 Food/Dining 45.18 .2529 Hide Feedback Partially Correct The owner of Showtime Movie Theaters, Inc., would like to predict Weekly gross revenue as a function of advertising expenditures. Historical data for a sample of eight was arred into the Microcal Online file below. the XL Miner Analysis ToolPak to perform your regression analysis in the designated areas of the spreadsheet Open spreadsheet a. Develop an estimated regression equation with the amount of television advertising the independent variable (to 2 decimals) Revenue - 21407 753 TVA b. Develop an estimated regression equation with both television advertising and newspaper advertising as the independent variables to 2 decimals) Revenue TWAY News c. Is the estimated repression equation coefficient for television advertising expenditures the same in part(a) and in part d. Predict weekly gross revenue for a week when 54 thousand is spent on television advertising and $3.9 thousand is spent on newspaper advertising to decim in thousands Weekly Gross Revenue (1000s) Television Advertising ($1000s) Newspaper Advertising ($1000s) 1 06 2 9. ON n o 9 met 6 3.3 2.3 rung 94 94 95 2.5


