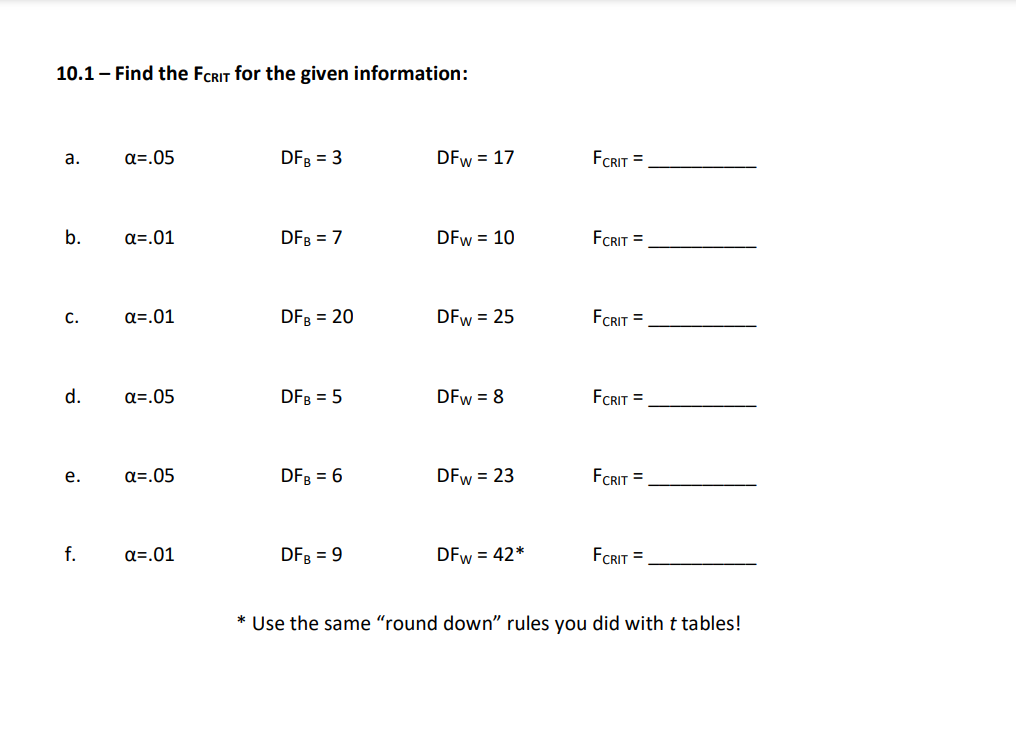
10.1 - Find the FCRIT for the given information: a. a=.05 DFB = 3 DFW = 17 FORIT = b. a=.01 DFB = 7 DFw
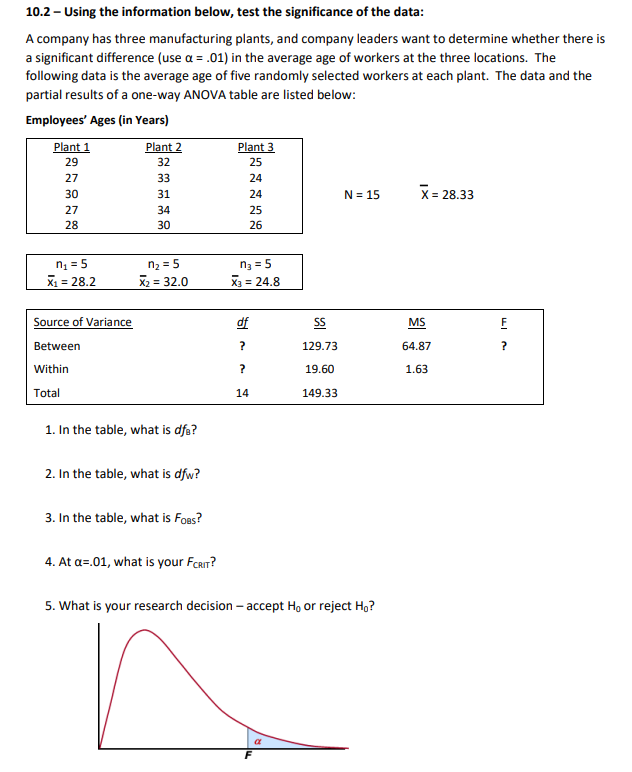
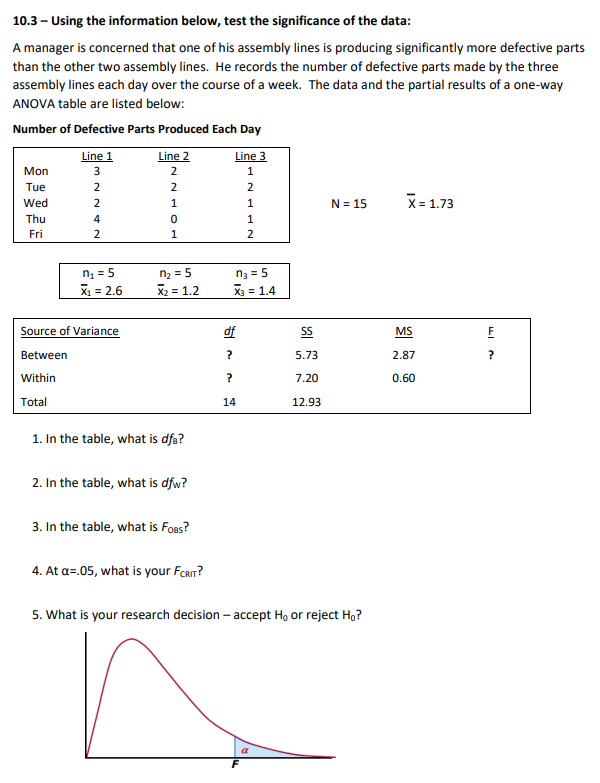
10.1 - Find the FCRIT for the given information: a. a=.05 DFB = 3 DFW = 17 FORIT = b. a=.01 DFB = 7 DFw = 10 FORIT = C. a=.01 DFB = 20 DFw = 25 FCRIT = d. a=.05 DFB = 5 DFW = 8 FCRIT = e. a=.05 DFB = 6 DFW = 23 FCRIT = f. a=.01 DFB = 9 DFW = 42* FCRIT = * Use the same "round down" rules you did with t tables!10.2 - Using the information below, test the signicance of the data: Acompanv has three manufacturing plants, and company leaders want to determine whether there is a significant difference {use [1 = .131] in the average age of workers at the three locations. The following data is the average age of five randomly selected workers at each plant. The data and the partial results of a one-way ANOVA table are listed below: Employees' Ages [in Yea r5] Plant 1 Plant 2 Plant 3 29 32 25 2? 33 24 _ 3D 31 24 N=15 K=2833 22 34 25 23 3D 26 n1 : n2 2 n3 : i1 = 23.2 i; = 32.0 E; = 24.8 Source of Variance 91' g E E Between i' 129.23 54.32 ? Within ? 19.60 1.63 TEItal 14 149.33 1. In the table, what is die? 2. In the table, what is du? 3. In the table, what is F095,? 4. At 12.01, what is your Fmr? 5. What is your research decision accept Ha or reject Hg? 10.3 - Using the information below. test the signicance of the data: A manager is concerned that one of his assembly lines is producing signicantly more defective parts than the other two assembly lines. He records the number of defective parts made by the three assembly lines each day over the course of a week. The data and the partial results of a oneway ANOVA table are listed below: Number of Defective Part5 Produced Each Day Line 1 Line 2 Line 3 Mon 3 2 1 Tue 2 2 2 _ Wed 2 1 1 N = 15 X = 1.?3 4 D 1 2 1 2 Source ef'ii'ariance g g E E Between ? 5.?3 2.3? ? Within ? 120 0.50 TDtaI 14 12.93 1. In the table; what is die? 2. In the table; what is ow? 3. In the table; what is F095? 4. At o=.DS, what is your Fun? 5. What is your research decision accept Hg or reject Hg? 10.4 - Using the information below, test the signicance of the data: Agroup of paramedics does not believe that the number of emergency calls is the same for each shift. To test their claim, they record the number of calls received during each shift for seven days. Based on this data, can the paramedics conclude that the average number of calls is different between shifts? The data and the partial results of a oneway ANOVA table are listed helm-v: Number of Emergency Calls Received per Shift Morning Afternoon N = 21 E = 3.52 Source of Variance of g E E Between ? 1:16? 5.33 ? Within i' 2-1.5:Ir 1.3:Ir TEItal 20 35.24 1. In the table, what is rife? 2. In the table, what is dfw? 3. In the table, what is Fags? 4. At {1:01. what is your Fun? 5. What is your research decision accept Hg or reject Hg? 10.5 - Using the information below. test the signicance of the data: A university is comparing the GPAs between the four sororities on campus. The GPAs for ten girls in each sorority are shown below. Based on this data, can you conclude that there is a significant difference in the average GPA between the four sororities on campus? GPA: of Four Campus Sororities TriDelta Phi Mu Ehi Omega Beta Phi 2.5 3.1 2.? 3.1 3.4 3.4 2.9 3.2 4.0 3.6 2.3 3.1 N : 40 E : 3_15 3.3 3.6 2.3 2.3 2.? 3.? 2.9 2.9 2.3 3.0 3.1 3.1 2.3 4.0 2.9 3.0 3.2 3.3 2.? 3.3 3.1 4.0 2.5 2.? 3.9 3.4 3.3 2.5 [11:10 I12: 10 n;=10 04:10 1=3.2 1=3.5 3=2.9 =3.D Source of'iiariance g g E E Between 2' 2.83 0.96 ? Within ? 4.53 0.13 Total 39 142 1. In the table; what is die? 2. In the table; what is ow? 3. In the table; what is F095? 4. At {12.05, what is your Farm"? 5. What is your research decision accept Hg or reject Hg
Step by Step Solution
There are 3 Steps involved in it
Step: 1
Get Instant Access to Expert-Tailored Solutions
See step-by-step solutions with expert insights and AI powered tools for academic success
Step: 2
Step: 3
Ace Your Homework with AI
Get the answers you need in no time with our AI-driven, step-by-step assistance