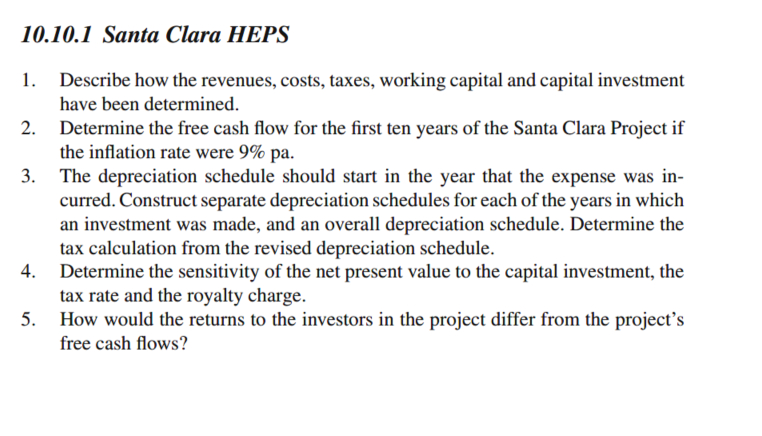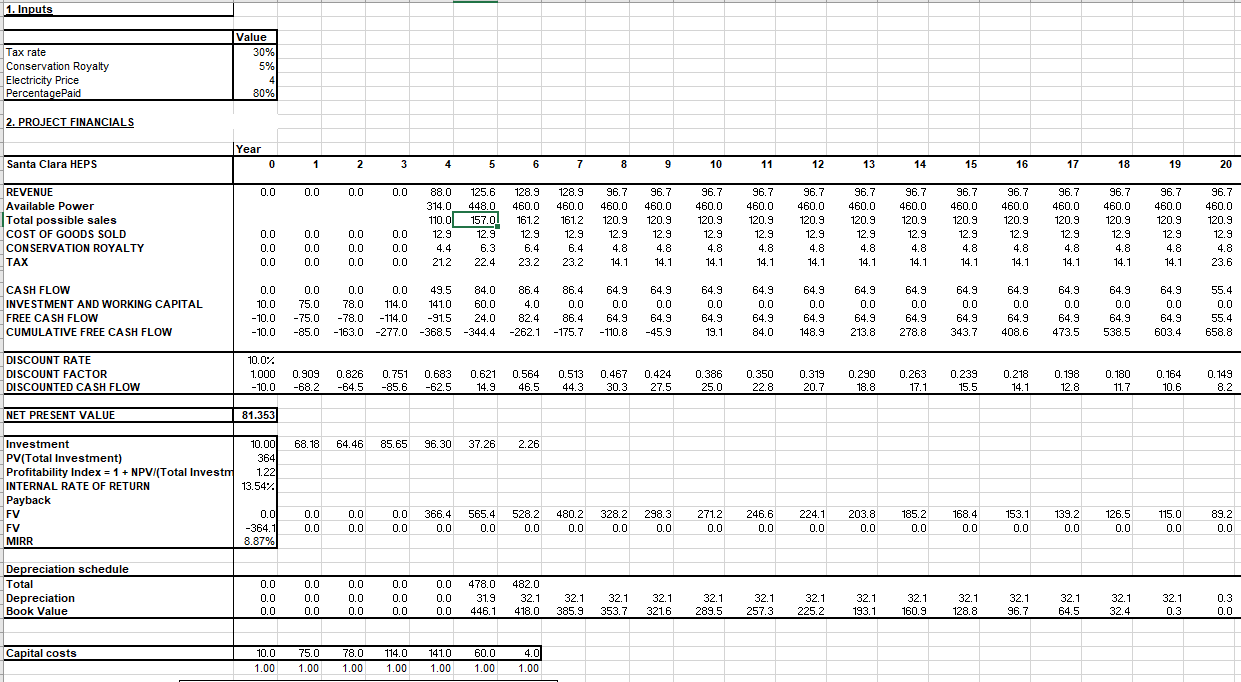

10.10.1 Santa Clara HEPS 1. Describe how the revenues, costs, taxes, working capital and capital investment have been determined. 2. Determine the free cash flow for the first ten years of the Santa Clara Project if the inflation rate were 9% pa. 3. The depreciation schedule should start in the year that the expense was in- curred. Construct separate depreciation schedules for each of the years in which an investment was made, and an overall depreciation schedule. Determine the tax calculation from the revised depreciation schedule. 4. Determine the sensitivity of the net present value to the capital investment, the tax rate and the royalty charge. 5. How would the returns to the investors in the project differ from the project's free cash flows? 1. Inputs Tax rate Conservation Royalty Electricity Price Percentage Paid Value 30% 5% 4 80% 2. PROJECT FINANCIALS Year Santa Clara HEPS 0 1 2 3 4 5 6 7 8 8 9 10 11 12 13 14 15 16 17 18 19 20 0.0 0.0 0.0 0.0 REVENUE Available Power Total possible sales COST OF GOODS SOLD CONSERVATION ROYALTY TAX 88.0 314.0 110.0 12.9 4.4 21.2 125.6 448.0 157.0 12.9 6.3 22.4 128.9 460.0 161.2 12.9 6.4 23.2 128.9 460.0 161.2 12.9 6.4 23.2 96.7 460.0 120.9 96.7 460,0 120.9 12.9 4.8 14.1 96.7 460.0 120.9 12.9 4.8 14.1 96.7 460.0 120.9 12.9 4.8 14.1 96.7 460.0 120.9 12.9 4.8 14.1 96.7 460.0 120.9 12.9 4.8 14.1 96.7 460.0 120.9 12.9 4.8 14.1 96.7 460.0 120.9 12.9 4.8 14.1 96.7 460.0 120.9 12.9 4.8 14.1 96.7 460.0 120.9 12.9 4.8 14.1 96.7 460.0 120.9 12.9 4.8 14.1 96.7 460.0 120.9 12.9 4.8 14.1 96.7 460.0 120.9 12.9 4.8 23.6 12.9 0.0 0.0 0.0 0.0 0.0 0.0 0.0 0.0 0.0 0.0 0.0 0.0 4.8 14.1 CASH FLOW INVESTMENT AND WORKING CAPITAL FREE CASH FLOW CUMULATIVE FREE CASH FLOW 0.0 10.0 -10.0 -10.0 0.0 75.0 -75.0 -85.0 0.0 0.0 49.5 84.0 78.0 114.0 1410 60.0 -78.0 - 114.0 -91.5 24.0 -163.0 -277.0 -368.5 -344.4 86.4 4.0 82.4 -262.1 86.4 0.0 86.4 -175.7 64.9 0.0 64.9 -110.8 64.9 0.0 64.9 -45.9 64.9 0.0 64.9 19.1 64.9 0.0 64.9 84.0 64.9 0.0 64.9 148.9 64.9 0.0 64.9 213.8 64.9 0.0 64.9 278.8 64.9 0.0 64.9 343.7 64.9 0.0 64.9 408.6 64.9 0.0 64.9 473.5 64.9 0.0 64.9 538.5 64.9 0.0 64.9 603.4 55.4 0.0 55.4 658.8 DISCOUNT RATE DISCOUNT FACTOR DISCOUNTED CASH FLOW 10.0% 1.000 -10.0 0.909 -68.2 0.826 -64.5 0.751 -85.6 0.683 -62.5 0.621 14.9 0.564 46.5 0.513 44.3 0.467 30.3 0.424 27.5 0.386 25.0 0.350 22.8 0.319 20.7 0.290 18.8 0.263 17.1 0.239 15.5 0.218 14.1 0.198 12.8 0.180 11.7 0.164 10.6 0.149 8.2 NET PRESENT VALUE 81.353 68.18 64.46 85.65 96.30 37.26 2.26 10.00 3641 1.221 13.54% Investment PV(Total Investment) Profitability Index = 1 + NPVI(Total Invest INTERNAL RATE OF RETURN Payback FV FV MIRR 366.4 203.8 139.2 0.0 -364.1 8.87% 0.0 0.0 0.0 0.0 0.0 0.0 565.4 00 528.2 0.0 480.2 0.0 328.2 0.0 298.3 0.0 2712 0.0 246.6 0.0 224.1 0.0 185.2 0.0 168,4 0.0 153.1 0.0 126.5 0.0 115.0 0.0 89.2 0.0 0.0 0.0 0.0 Depreciation schedule Total Depreciation Book Value 0.0 0.0 0.0 0.0 0.0 0.0 0.0 0.0 0.0 0.0 0.0 0.0 0.0 0.0 0.0 478.0 31.9 446.1 482.0 32.1 418,0 32.1 385.9 32.1 353.7 32.1 321.6 32.1 289.5 32.1 257.3 32.1 225.2 32.1 193.1 32.1 160.9 32.1 128.8 32.1 96.7 32.1 64.5 32.1 32.4 32.1 0.3 0.3 0.0 Capital costs 10.0 1.00 75.0 1.00 78.0 1.00 114.0 1.00 141.0 1.00 60.0 1.00 4.0 1.00


