Answered step by step
Verified Expert Solution
Question
1 Approved Answer
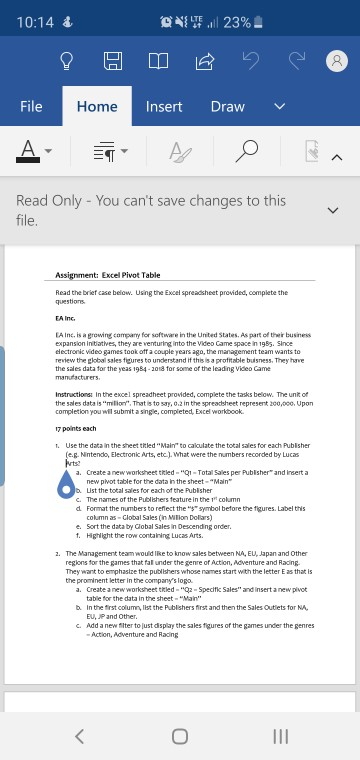
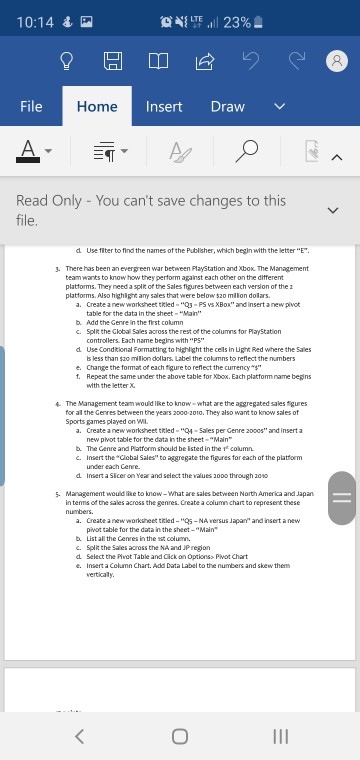
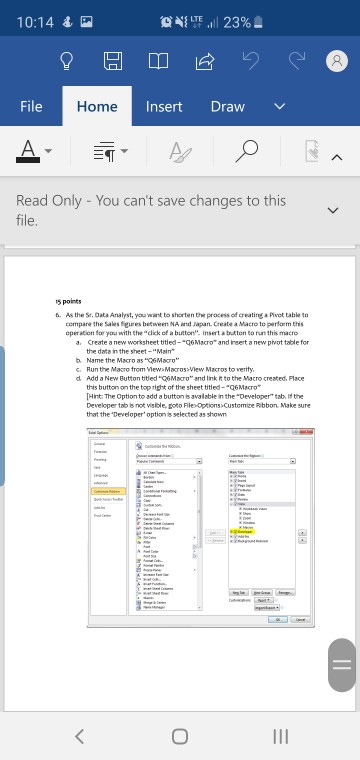
10:14 23%. ,il File Home Insert Draw Read Only You can't save changes to this Assignment: Excel Pivot Table Read the brief case below. questions


10:14 23%. ,il File Home Insert Draw Read Only You can't save changes to this Assignment: Excel Pivot Table Read the brief case below. questions Using the Excel spreadsheet provided, complete the EAInc. is a growing compamy for sotware in the United States. As part of their business expansion in batives, they are venturing into the video Came space in 1955. Since dectronic video games took otf a couple years ago, the management team wants to review the global sales figures to understand If this is a prottable buisness. They have the sales data for the yeas 1984-2018 tor some of the leading video Came Instructionei In the excel spreadheet provided, complete the tasks below. The unit of the sales data is "milion", That is to say, 0.2 in the spreadsheet represent 200,000,Upon completion you wil submit a sngle, completed, Excel workbook 17 points each . Use the data in the sheet tkled "Main" to calulate the total sales for each Pubisher intenda, Electronicrts, etc.. What were the numbers recorded by Luca a. Create a new worksheet tiled "1-Total Sales per Publsher and Insert a new pvot table for the data in the sheet-Main c. The names of the Publshers feature in the 1t column d Format the numbers to reflect thesymbol before the figures. Label this column as-Clobal Sales Cin Milion Dolars Sort the data by Cobal Sales in Descending order. e. t Highight the row containing Lucas Arts The Management team would like to know sales between NA, EU, Japan and Other regions tor the games that fal under the genre of Action, Adventure and Rading. They want to emphasize the publishers whose names start with the letter E as that is the prominent letter in the company's logo. 2 . Create a newworksheet tkled-2-Specifk Sales" and insert anew pivot in the sheet b. In the first colum, list the Publishers first and then the Sales Outlets for NA EU, JP and Other. c. Adda new filter to just display the sales figures of the games under the genres Action, Adventure and Rading 10:14 LTE File Home Insert Draw Read Only You can't save changes to this d Use titer to find the names of the Publisher, which begin with the letter"E" 3. There has been an evergreen war between Playstation and Xbox The Management team wants to know how they perform against each other on the ditferent platforms. They need a spit of the Sales fiaures between each version of the platforms. Also highighany sales that were below $z0 mlion dolars a. Createa newworksheet tiled- "Q-PS vs XBox" and insert a new plvot in the sheet the Genre int C. Splia the Global Sales across the rest of the oolumns for PlayStation controllers Each name begine with "PS d Use Conditional Formatting to highlght the cels in Light Red where the Sales s less than s$z0 ml ars Label the co e. Change the format of each figure to reflect the currency" 1. Repeat the same under the above table for Xbox. Each platfom name begns 4 The Management team would llke to know-what are the aggregated sales gures for al the Genres between the years 2000 20t0. They also want to know sales of Sports games played on a. Create a newworksheet tkled 4-Saes per Genre 2000s" and inserta new pivot table for the data in the sheet Main c. Insert the "Gobal Sales to aggregate the figures for each of the plattorm d Insert aSicer on Year and select the values 20oo through 2010 Genre and Platform should be is ed in s Management wouid like to know-what are sales between North America and Japan in terms of the sales across the genres. Create a column chart to represent these . Create anew workshee tied-"5-NAwersus Japa" and insert anew pvot table for the data in the sheet-"Main c. Split the Sales across the NA and JP region d Select the Awot Table and Cick onOptions> Piot chart kew them verticaly 10:14 LTE File Home Insert Draw Read Only You can't save changes to this 15 points 6. As the St. Data Analyst, you want to shorten the process of creatinga Pivct table to compare the Sales gres between NA and Japan. Create a Macro to perfarm thi operation for you with the"click of a button" Insert a button to un this macno . Create a new worksheet titled-"6Macro and Ireert a new phot table for the data in the sheet-"Main b, Name the Macro as "g6Mao" . Run the Macro from Wew>MarosView Macros to vertfy d Add a New Button titied'g6Mao"and link to the Macro created. Place this button on the top right of the sheet titled-6Macro Hint: The Option to add a button is avalable in the "Developer" tab, If the Developer tab not wable, goto that the "Developer' option t"elected 35 shown 10:14 23%. ,il File Home Insert Draw Read Only You can't save changes to this Assignment: Excel Pivot Table Read the brief case below. questions Using the Excel spreadsheet provided, complete the EAInc. is a growing compamy for sotware in the United States. As part of their business expansion in batives, they are venturing into the video Came space in 1955. Since dectronic video games took otf a couple years ago, the management team wants to review the global sales figures to understand If this is a prottable buisness. They have the sales data for the yeas 1984-2018 tor some of the leading video Came Instructionei In the excel spreadheet provided, complete the tasks below. The unit of the sales data is "milion", That is to say, 0.2 in the spreadsheet represent 200,000,Upon completion you wil submit a sngle, completed, Excel workbook 17 points each . Use the data in the sheet tkled "Main" to calulate the total sales for each Pubisher intenda, Electronicrts, etc.. What were the numbers recorded by Luca a. Create a new worksheet tiled "1-Total Sales per Publsher and Insert a new pvot table for the data in the sheet-Main c. The names of the Publshers feature in the 1t column d Format the numbers to reflect thesymbol before the figures. Label this column as-Clobal Sales Cin Milion Dolars Sort the data by Cobal Sales in Descending order. e. t Highight the row containing Lucas Arts The Management team would like to know sales between NA, EU, Japan and Other regions tor the games that fal under the genre of Action, Adventure and Rading. They want to emphasize the publishers whose names start with the letter E as that is the prominent letter in the company's logo. 2 . Create a newworksheet tkled-2-Specifk Sales" and insert anew pivot in the sheet b. In the first colum, list the Publishers first and then the Sales Outlets for NA EU, JP and Other. c. Adda new filter to just display the sales figures of the games under the genres Action, Adventure and Rading 10:14 LTE File Home Insert Draw Read Only You can't save changes to this d Use titer to find the names of the Publisher, which begin with the letter"E" 3. There has been an evergreen war between Playstation and Xbox The Management team wants to know how they perform against each other on the ditferent platforms. They need a spit of the Sales fiaures between each version of the platforms. Also highighany sales that were below $z0 mlion dolars a. Createa newworksheet tiled- "Q-PS vs XBox" and insert a new plvot in the sheet the Genre int C. Splia the Global Sales across the rest of the oolumns for PlayStation controllers Each name begine with "PS d Use Conditional Formatting to highlght the cels in Light Red where the Sales s less than s$z0 ml ars Label the co e. Change the format of each figure to reflect the currency" 1. Repeat the same under the above table for Xbox. Each platfom name begns 4 The Management team would llke to know-what are the aggregated sales gures for al the Genres between the years 2000 20t0. They also want to know sales of Sports games played on a. Create a newworksheet tkled 4-Saes per Genre 2000s" and inserta new pivot table for the data in the sheet Main c. Insert the "Gobal Sales to aggregate the figures for each of the plattorm d Insert aSicer on Year and select the values 20oo through 2010 Genre and Platform should be is ed in s Management wouid like to know-what are sales between North America and Japan in terms of the sales across the genres. Create a column chart to represent these . Create anew workshee tied-"5-NAwersus Japa" and insert anew pvot table for the data in the sheet-"Main c. Split the Sales across the NA and JP region d Select the Awot Table and Cick onOptions> Piot chart kew them verticaly 10:14 LTE File Home Insert Draw Read Only You can't save changes to this 15 points 6. As the St. Data Analyst, you want to shorten the process of creatinga Pivct table to compare the Sales gres between NA and Japan. Create a Macro to perfarm thi operation for you with the"click of a button" Insert a button to un this macno . Create a new worksheet titled-"6Macro and Ireert a new phot table for the data in the sheet-"Main b, Name the Macro as "g6Mao" . Run the Macro from Wew>MarosView Macros to vertfy d Add a New Button titied'g6Mao"and link to the Macro created. Place this button on the top right of the sheet titled-6Macro Hint: The Option to add a button is avalable in the "Developer" tab, If the Developer tab not wable, goto that the "Developer' option t"elected 35 shown
Step by Step Solution
There are 3 Steps involved in it
Step: 1

Get Instant Access to Expert-Tailored Solutions
See step-by-step solutions with expert insights and AI powered tools for academic success
Step: 2

Step: 3

Ace Your Homework with AI
Get the answers you need in no time with our AI-driven, step-by-step assistance
Get Started


