

Answered step by step
Verified Expert Solution
Question
1 Approved Answer
10.17. Consider the data given in Table 10-7 (on the textbook's Web site) relating to stock prices and GDP for the period 1980-2006. a.
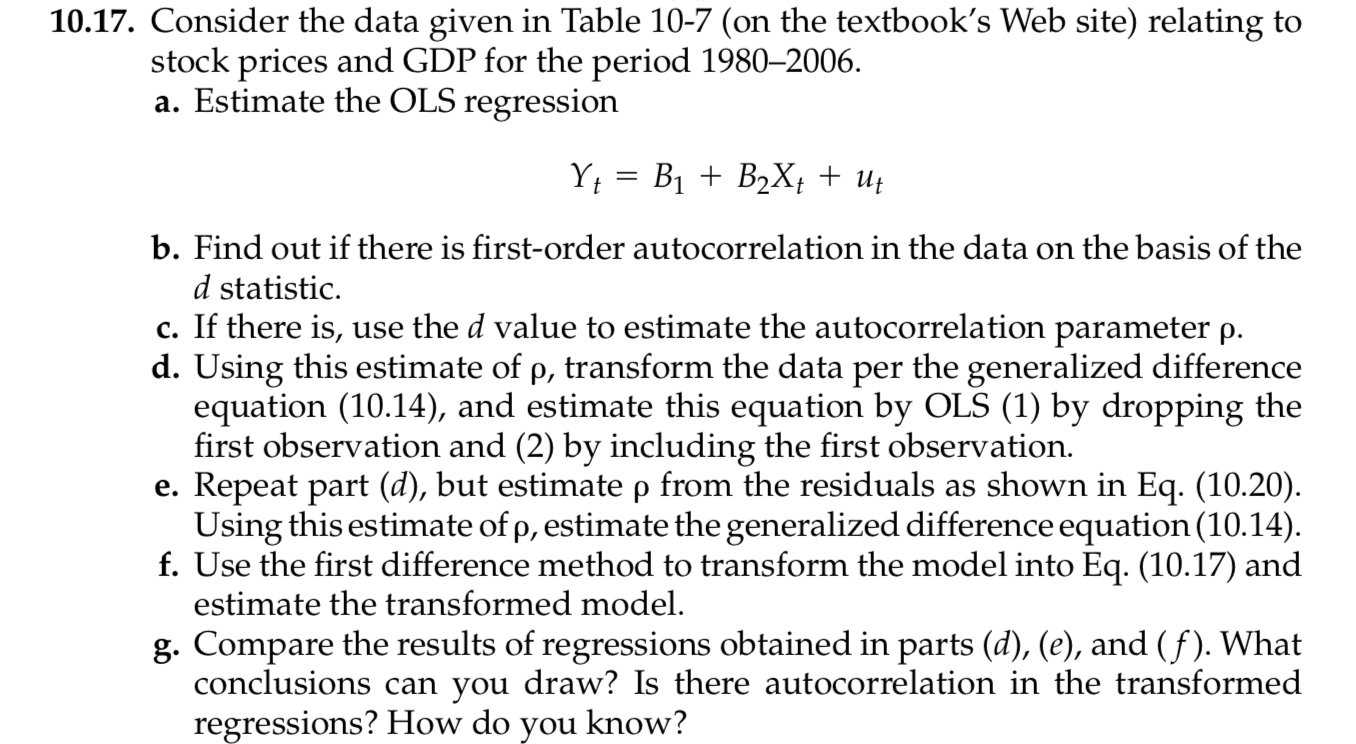
10.17. Consider the data given in Table 10-7 (on the textbook's Web site) relating to stock prices and GDP for the period 1980-2006. a. Estimate the OLS regression Y = B + B2X+ + Ut b. Find out if there is first-order autocorrelation in the data on the basis of the d statistic. c. If there is, use the d value to estimate the autocorrelation parameter p. d. Using this estimate of p, transform the data per the generalized difference equation (10.14), and estimate this equation by OLS (1) by dropping the first observation and (2) by including the first observation. e. Repeat part (d), but estimate p from the residuals as shown in Eq. (10.20). Using this estimate of p, estimate the generalized difference equation (10.14). f. Use the first difference method to transform the model into Eq. (10.17) and estimate the transformed model. g. Compare the results of regressions obtained in parts (d), (e), and (f). What conclusions can you draw? Is there autocorrelation in the transformed regressions? How do you know?
Step by Step Solution
There are 3 Steps involved in it
Step: 1

Get Instant Access to Expert-Tailored Solutions
See step-by-step solutions with expert insights and AI powered tools for academic success
Step: 2

Step: 3
Ace Your Homework with AI
Get the answers you need in no time with our AI-driven, step-by-step assistance
Get Started
Accounting Texts and Cases
Authors: Robert Anthony, David Hawkins, Kenneth Merchant
13th edition
1259097129, 978-0073379593, 007337959X, 978-1259097126