

Answered step by step
Verified Expert Solution
Question
1 Approved Answer
10.2 Consider the National Football League data in Table B.1. Restricting your attention to regressors x1 (rushing yards), x2 (passing yards), x4 (field goal percentage),
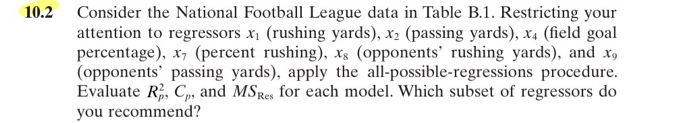
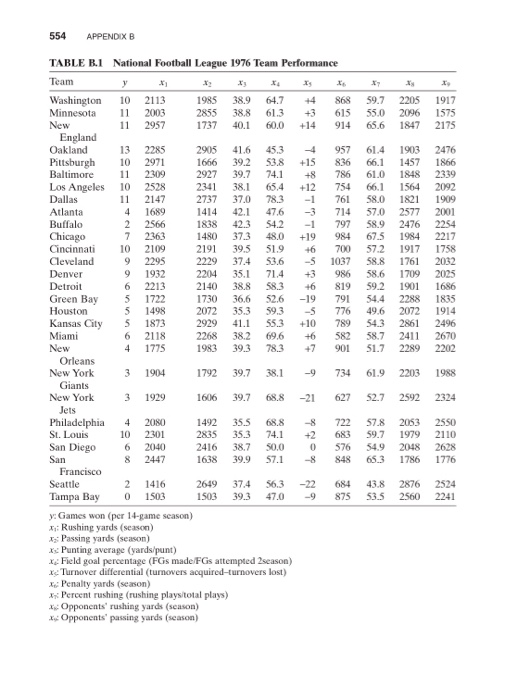 10.2 Consider the National Football League data in Table B.1. Restricting your attention to regressors x1 (rushing yards), x2 (passing yards), x4 (field goal percentage), x, (percent rushing), xs (opponents' rushing yards), and X, (opponents' passing yards), apply the all-possible-regressions procedure. Evaluate R, Cp, and MSRes for each model. Which subset of regressors do you recommend? 554 APPENDIX B 59.7 55.0 65.6 2205 2096 1847 1917 1575 2175 61.4 66.1 61.0 66.1 58.0 57.0 58.9 67.5 57.2 58.8 58.6 59.2 54.4 1903 1457 1848 1564 1821 2577 2476 1984 1917 1761 1709 1901 2288 2072 2861 2411 2289 2476 1866 2339 2092 1909 2001 2254 2217 1758 2032 2025 1686 1835 1914 2496 2670 2202 986 TABLE B.1 National Football League 1976 Team Performance Team Washington 10 2113 1985 38.9 64.7 868 Minnesota 11 2003 2855 38.8 61.3 +3 615 New 11 2957 1737 40.1 60.0 +14 914 England Oakland 13 2285 2905 41.6 45.3 957 Pittsburgh 10 2971 1666 39.2 53.8 +15 836 Baltimore 11 2309 2927 39.7 74.1 +8 786 Los Angeles 10 2528 2341 38.1 65.4 +12 754 Dallas 11 2147 2737 37,0 78.3 761 Atlanta 4 1689 1414 42.1 47.6 714 Buffalo 2 2566 1838 42.3 54.2 -1 797 Chicago 7 2363 1480 37.3 48.0 +19 984 Cincinnati 10 2109 2191 39.5 51.9 +6 700 Cleveland 9 2295 2229 37.4 53.6 -5 1037 Denver 9 1932 2204 35.1 71.4 Detroit 6 2213 2140 38.8 58.3 +6 819 Green Bay 5 1722 1730 36.6 52.6 -19 Houston 5 1498 2072 35.3 59,3 -S Kansas City 5 1873 2929 41.1 55.3 +10 789 Miami 6 2118 2268 38.2 69,6 +6 582 New 4 1775 1983 39.3 78.3 +7 901 Orleans New York 3 1904 1792 39.7 38.1 734 Giants New York 3 1929 1606 39.7 68.8 -21 627 Jets Philadelphia 4 2080 1492 35.5 68.8 -8 722 St. Louis 10 2301 2835 35.3 74.1 +2 San Diego 6 2040 2416 38.7 50.0 0 576 San 8 2447 1638 39.9 57.1 -8 848 Francisco Seattle 2 1416 2649 37.4 56.3 -22 684 Tampa Bay 0 1503 1503 39.3 47.0 -9 875 y: Games won (per 14-game scason) x Rushing yards (season) Is Passing yards (season) X Punting average (yards/punt) xField goal percentage (FGs made/FGs attempted season) Xe Turnover differential turnovers acquired-turnovers lost) x: Penalty yards (season) X Percent rushing (rushing plays/total plays) X. Opponents' rushing yards (season) X. Opponents' passing yards (season) 791 776 49.6 54.3 58.7 51.7 -9 61.9 2203 1988 52.7 2592 2324 57.8 59.7 54.9 65.3 2053 1979 2048 1786 2550 2110 2628 1776 2876 2560 2524 2241 53.5 10.2 Consider the National Football League data in Table B.1. Restricting your attention to regressors x1 (rushing yards), x2 (passing yards), x4 (field goal percentage), x, (percent rushing), xs (opponents' rushing yards), and X, (opponents' passing yards), apply the all-possible-regressions procedure. Evaluate R, Cp, and MSRes for each model. Which subset of regressors do you recommend? 554 APPENDIX B 59.7 55.0 65.6 2205 2096 1847 1917 1575 2175 61.4 66.1 61.0 66.1 58.0 57.0 58.9 67.5 57.2 58.8 58.6 59.2 54.4 1903 1457 1848 1564 1821 2577 2476 1984 1917 1761 1709 1901 2288 2072 2861 2411 2289 2476 1866 2339 2092 1909 2001 2254 2217 1758 2032 2025 1686 1835 1914 2496 2670 2202 986 TABLE B.1 National Football League 1976 Team Performance Team Washington 10 2113 1985 38.9 64.7 868 Minnesota 11 2003 2855 38.8 61.3 +3 615 New 11 2957 1737 40.1 60.0 +14 914 England Oakland 13 2285 2905 41.6 45.3 957 Pittsburgh 10 2971 1666 39.2 53.8 +15 836 Baltimore 11 2309 2927 39.7 74.1 +8 786 Los Angeles 10 2528 2341 38.1 65.4 +12 754 Dallas 11 2147 2737 37,0 78.3 761 Atlanta 4 1689 1414 42.1 47.6 714 Buffalo 2 2566 1838 42.3 54.2 -1 797 Chicago 7 2363 1480 37.3 48.0 +19 984 Cincinnati 10 2109 2191 39.5 51.9 +6 700 Cleveland 9 2295 2229 37.4 53.6 -5 1037 Denver 9 1932 2204 35.1 71.4 Detroit 6 2213 2140 38.8 58.3 +6 819 Green Bay 5 1722 1730 36.6 52.6 -19 Houston 5 1498 2072 35.3 59,3 -S Kansas City 5 1873 2929 41.1 55.3 +10 789 Miami 6 2118 2268 38.2 69,6 +6 582 New 4 1775 1983 39.3 78.3 +7 901 Orleans New York 3 1904 1792 39.7 38.1 734 Giants New York 3 1929 1606 39.7 68.8 -21 627 Jets Philadelphia 4 2080 1492 35.5 68.8 -8 722 St. Louis 10 2301 2835 35.3 74.1 +2 San Diego 6 2040 2416 38.7 50.0 0 576 San 8 2447 1638 39.9 57.1 -8 848 Francisco Seattle 2 1416 2649 37.4 56.3 -22 684 Tampa Bay 0 1503 1503 39.3 47.0 -9 875 y: Games won (per 14-game scason) x Rushing yards (season) Is Passing yards (season) X Punting average (yards/punt) xField goal percentage (FGs made/FGs attempted season) Xe Turnover differential turnovers acquired-turnovers lost) x: Penalty yards (season) X Percent rushing (rushing plays/total plays) X. Opponents' rushing yards (season) X. Opponents' passing yards (season) 791 776 49.6 54.3 58.7 51.7 -9 61.9 2203 1988 52.7 2592 2324 57.8 59.7 54.9 65.3 2053 1979 2048 1786 2550 2110 2628 1776 2876 2560 2524 2241 53.5
Step by Step Solution
There are 3 Steps involved in it
Step: 1

Get Instant Access to Expert-Tailored Solutions
See step-by-step solutions with expert insights and AI powered tools for academic success
Step: 2

Step: 3
Ace Your Homework with AI
Get the answers you need in no time with our AI-driven, step-by-step assistance
Get Started
Health And Safety Audit An External Audit Perspective
Authors: Abdel Rahman Mansour
1st Edition
6139899648, 978-6139899647