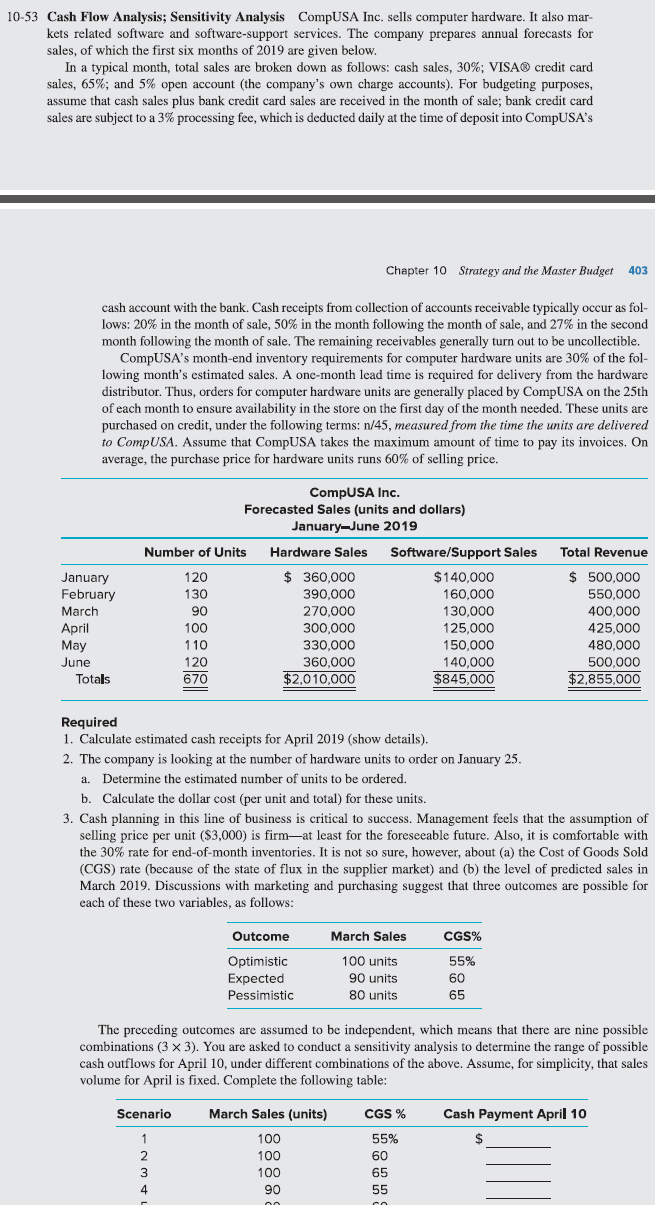
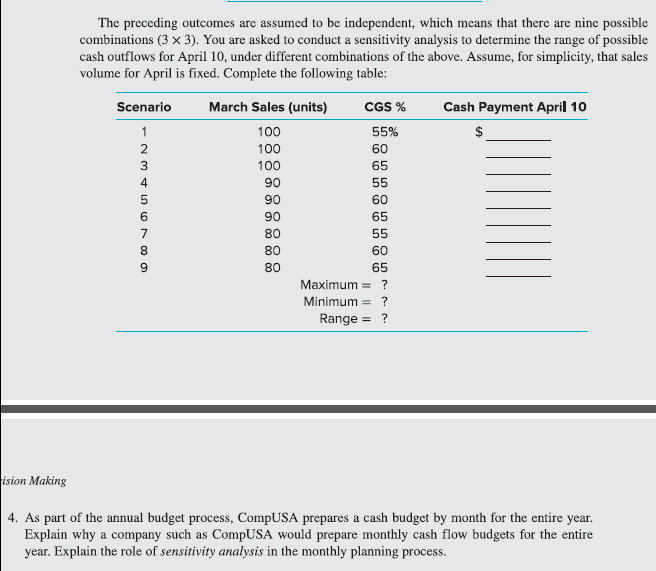
10-53 Cash Flow Analysis: Sensitivity Analysis CompUSA Inc. sells computer hardware. It also mar- kets related software and software-support services. The company prepares annual forecasts for sales, of which the first six months of 2019 are given below. In a typical month, total sales are broken down as follows: cash sales, 30%; VISA credit card sales, 65%; and 5% open account (the company's own charge accounts). For budgeting purposes, assume that cash sales plus bank credit card sales are received in the month of sale; bank credit card sales are subject to a 3% processing fee, which is deducted daily at the time of deposit into CompUSA's Chapter 10 Strategy and the Master Budget 403 cash account with the bank. Cash receipts from collection of accounts receivable typically occur as fol- lows: 20% in the month of sale, 50% in the month following the month of sale, and 27% in the second month following the month of sale. The remaining receivables generally turn out to be uncollectible. CompUSA's month-end inventory requirements for computer hardware units are 30% of the fol- lowing month's estimated sales. A one-month lead time is required for delivery from the hardware distributor. Thus, orders for computer hardware units are generally placed by CompUSA on the 25th of each month to ensure availability in the store on the first day of the month needed. These units are purchased on credit, under the following terms: n/45, measured from the time the units are delivered to CompUSA. Assume that CompUSA takes the maximum amount of time to pay its invoices. On average, the purchase price for hardware units runs 60% of selling price. Total Revenue January February March April May June Totals CompUSA Inc. Forecasted Sales (units and dollars) January-June 2019 Number of Units Hardware Sales Software/Support Sales 120 $ 360,000 $140,000 130 390,000 160,000 90 270,000 130,000 100 300,000 125,000 110 330,000 150,000 120 360,000 140,000 670 $2,010,000 $845,000 $ 500,000 550,000 400,000 425,000 480,000 500,000 $2,855,000 Required 1. Calculate estimated cash receipts for April 2019 (show details). 2. The company is looking at the number of hardware units to order on January 25. a. Determine the estimated number of units to be ordered. b. Calculate the dollar cost (per unit and total) for these units. 3. Cash planning in this line of business is critical to success. Management feels that the assumption of selling price per unit ($3,000) is firmat least for the foreseeable future. Also, it is comfortable with the 30% rate for end-of-month inventories. It is not so sure, however, about (a) the Cost of Goods Sold (CGS) rate (because of the state of flux in the supplier market) and (b) the level of predicted sales in March 2019. Discussions with marketing and purchasing suggest that three outcomes are possible for each of these two variables, as follows: Outcome March Sales CGS% 55% Optimistic Expected Pessimistic 100 units 90 units 80 units 60 65 The preceding outcomes are assumed to be independent, which means that there are nine possible combinations (3 x 3). You are asked to conduct a sensitivity analysis to determine the range of possible cash outflows for April 10, under different combinations of the above. Assume, for simplicity, that sales volume for April is fixed. Complete the following table: Scenario CGS % Cash Payment April 10 March Sales (units) 100 100 100 90 2 3 4 55% 60 65 55 The preceding outcomes are assumed to be independent, which means that there are nine possible combinations (3 x 3). You are asked to conduct a sensitivity analysis to determine the range of possible cash outflows for April 10, under different combinations of the above. Assume, for simplicity, that sales volume for April is fixed. Complete the following table: Cash Payment April 10 $ Scenario 1 2 3 4 5 6 7 8 9 March Sales (units) CGS % 100 55% 100 60 100 65 90 55 90 60 90 65 80 55 80 80 65 Maximum = ? Minimum = ? Range = ? 60 ision Making 4. As part of the annual budget process, CompUSA prepares a cash budget by month for the entire year. Explain why a company such as CompUSA would prepare monthly cash flow budgets for the entire year. Explain the role of sensitivity analysis in the monthly planning process. 10-53 Cash Flow Analysis: Sensitivity Analysis CompUSA Inc. sells computer hardware. It also mar- kets related software and software-support services. The company prepares annual forecasts for sales, of which the first six months of 2019 are given below. In a typical month, total sales are broken down as follows: cash sales, 30%; VISA credit card sales, 65%; and 5% open account (the company's own charge accounts). For budgeting purposes, assume that cash sales plus bank credit card sales are received in the month of sale; bank credit card sales are subject to a 3% processing fee, which is deducted daily at the time of deposit into CompUSA's Chapter 10 Strategy and the Master Budget 403 cash account with the bank. Cash receipts from collection of accounts receivable typically occur as fol- lows: 20% in the month of sale, 50% in the month following the month of sale, and 27% in the second month following the month of sale. The remaining receivables generally turn out to be uncollectible. CompUSA's month-end inventory requirements for computer hardware units are 30% of the fol- lowing month's estimated sales. A one-month lead time is required for delivery from the hardware distributor. Thus, orders for computer hardware units are generally placed by CompUSA on the 25th of each month to ensure availability in the store on the first day of the month needed. These units are purchased on credit, under the following terms: n/45, measured from the time the units are delivered to CompUSA. Assume that CompUSA takes the maximum amount of time to pay its invoices. On average, the purchase price for hardware units runs 60% of selling price. Total Revenue January February March April May June Totals CompUSA Inc. Forecasted Sales (units and dollars) January-June 2019 Number of Units Hardware Sales Software/Support Sales 120 $ 360,000 $140,000 130 390,000 160,000 90 270,000 130,000 100 300,000 125,000 110 330,000 150,000 120 360,000 140,000 670 $2,010,000 $845,000 $ 500,000 550,000 400,000 425,000 480,000 500,000 $2,855,000 Required 1. Calculate estimated cash receipts for April 2019 (show details). 2. The company is looking at the number of hardware units to order on January 25. a. Determine the estimated number of units to be ordered. b. Calculate the dollar cost (per unit and total) for these units. 3. Cash planning in this line of business is critical to success. Management feels that the assumption of selling price per unit ($3,000) is firmat least for the foreseeable future. Also, it is comfortable with the 30% rate for end-of-month inventories. It is not so sure, however, about (a) the Cost of Goods Sold (CGS) rate (because of the state of flux in the supplier market) and (b) the level of predicted sales in March 2019. Discussions with marketing and purchasing suggest that three outcomes are possible for each of these two variables, as follows: Outcome March Sales CGS% 55% Optimistic Expected Pessimistic 100 units 90 units 80 units 60 65 The preceding outcomes are assumed to be independent, which means that there are nine possible combinations (3 x 3). You are asked to conduct a sensitivity analysis to determine the range of possible cash outflows for April 10, under different combinations of the above. Assume, for simplicity, that sales volume for April is fixed. Complete the following table: Scenario CGS % Cash Payment April 10 March Sales (units) 100 100 100 90 2 3 4 55% 60 65 55 The preceding outcomes are assumed to be independent, which means that there are nine possible combinations (3 x 3). You are asked to conduct a sensitivity analysis to determine the range of possible cash outflows for April 10, under different combinations of the above. Assume, for simplicity, that sales volume for April is fixed. Complete the following table: Cash Payment April 10 $ Scenario 1 2 3 4 5 6 7 8 9 March Sales (units) CGS % 100 55% 100 60 100 65 90 55 90 60 90 65 80 55 80 80 65 Maximum = ? Minimum = ? Range = ? 60 ision Making 4. As part of the annual budget process, CompUSA prepares a cash budget by month for the entire year. Explain why a company such as CompUSA would prepare monthly cash flow budgets for the entire year. Explain the role of sensitivity analysis in the monthly planning process