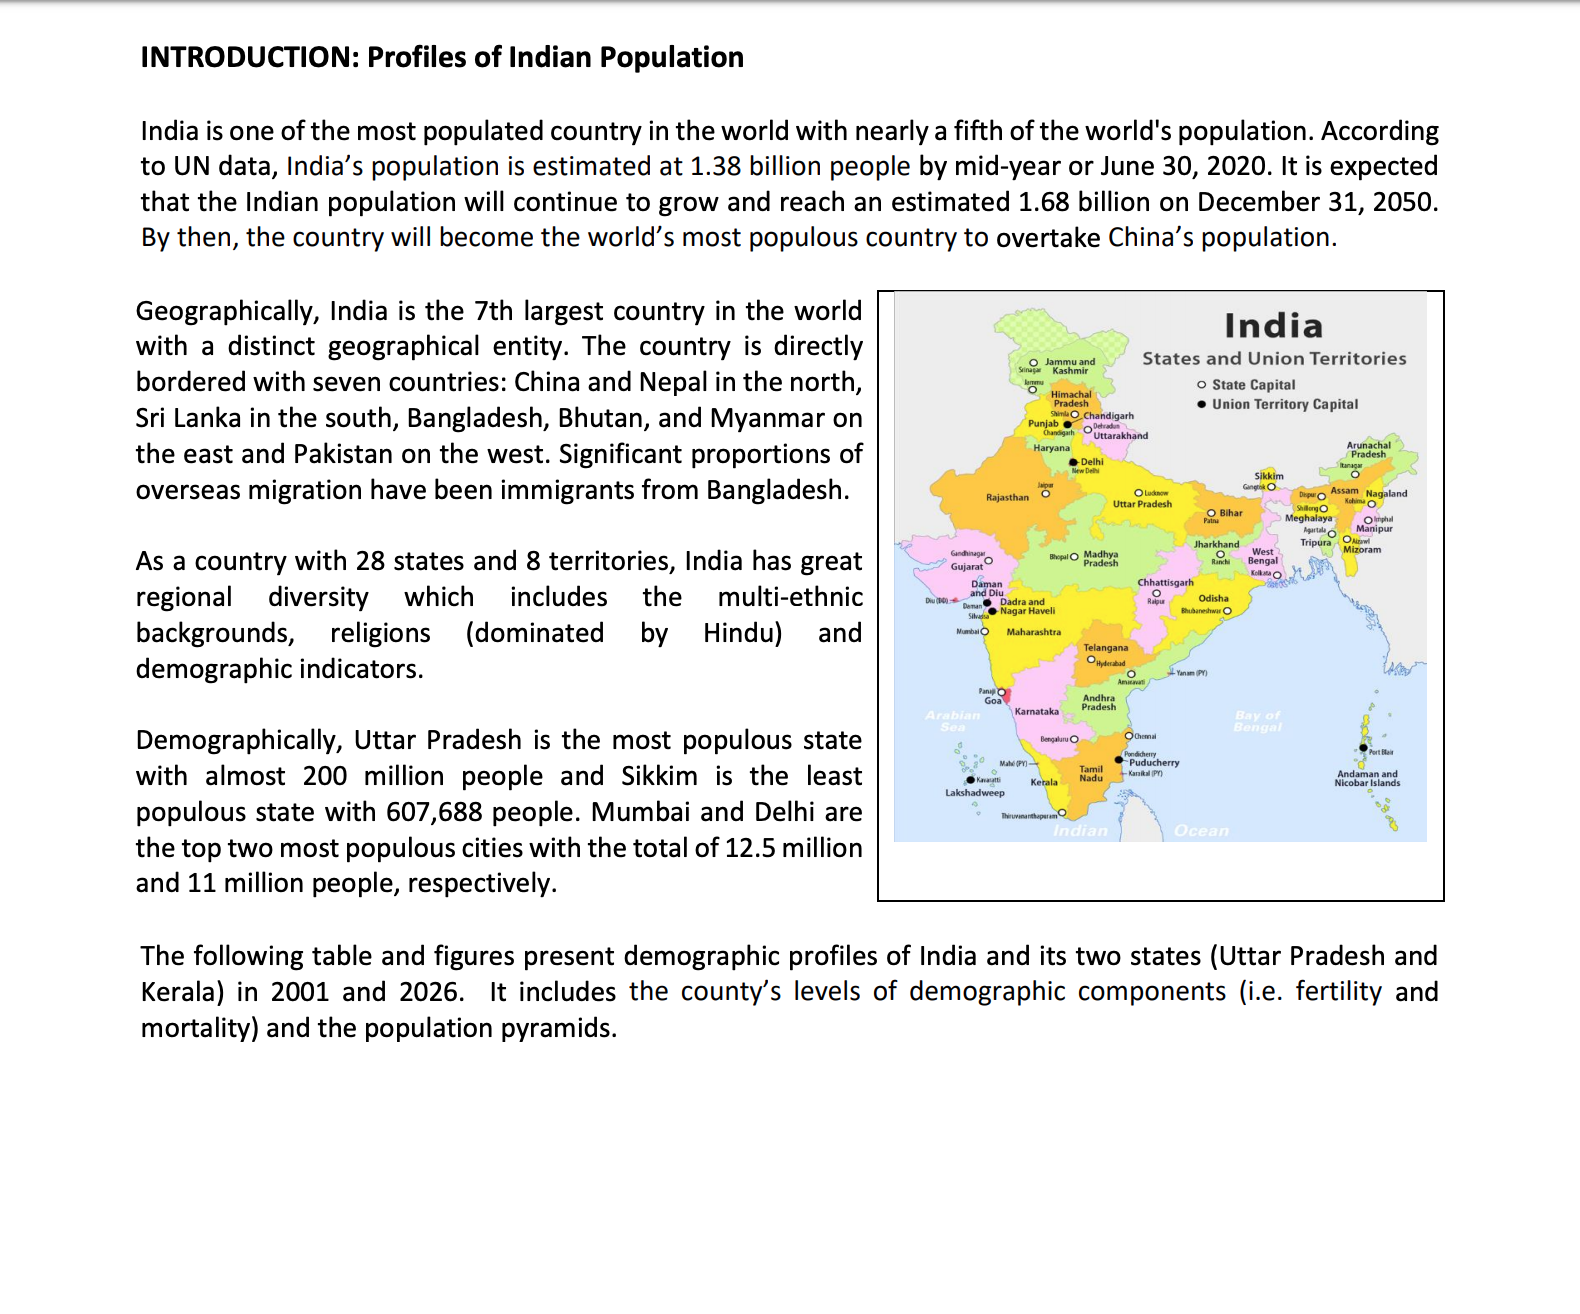
1.1. Having read the profiles of Indian population, please identify and explain what are the possible population challenges that can be faced by India, today and in the future?
1.2. Indian population growth (note: use the exponential growth equation).
a. Estimate the annual population growth rate in India between the period 30 June 2020 and 31 December 2050.
b. Estimate the population size of India on 30 June 2075, with the assumption if after 31/12/2050 the population grows continuously at the same rate as in the periods 2020-2050.
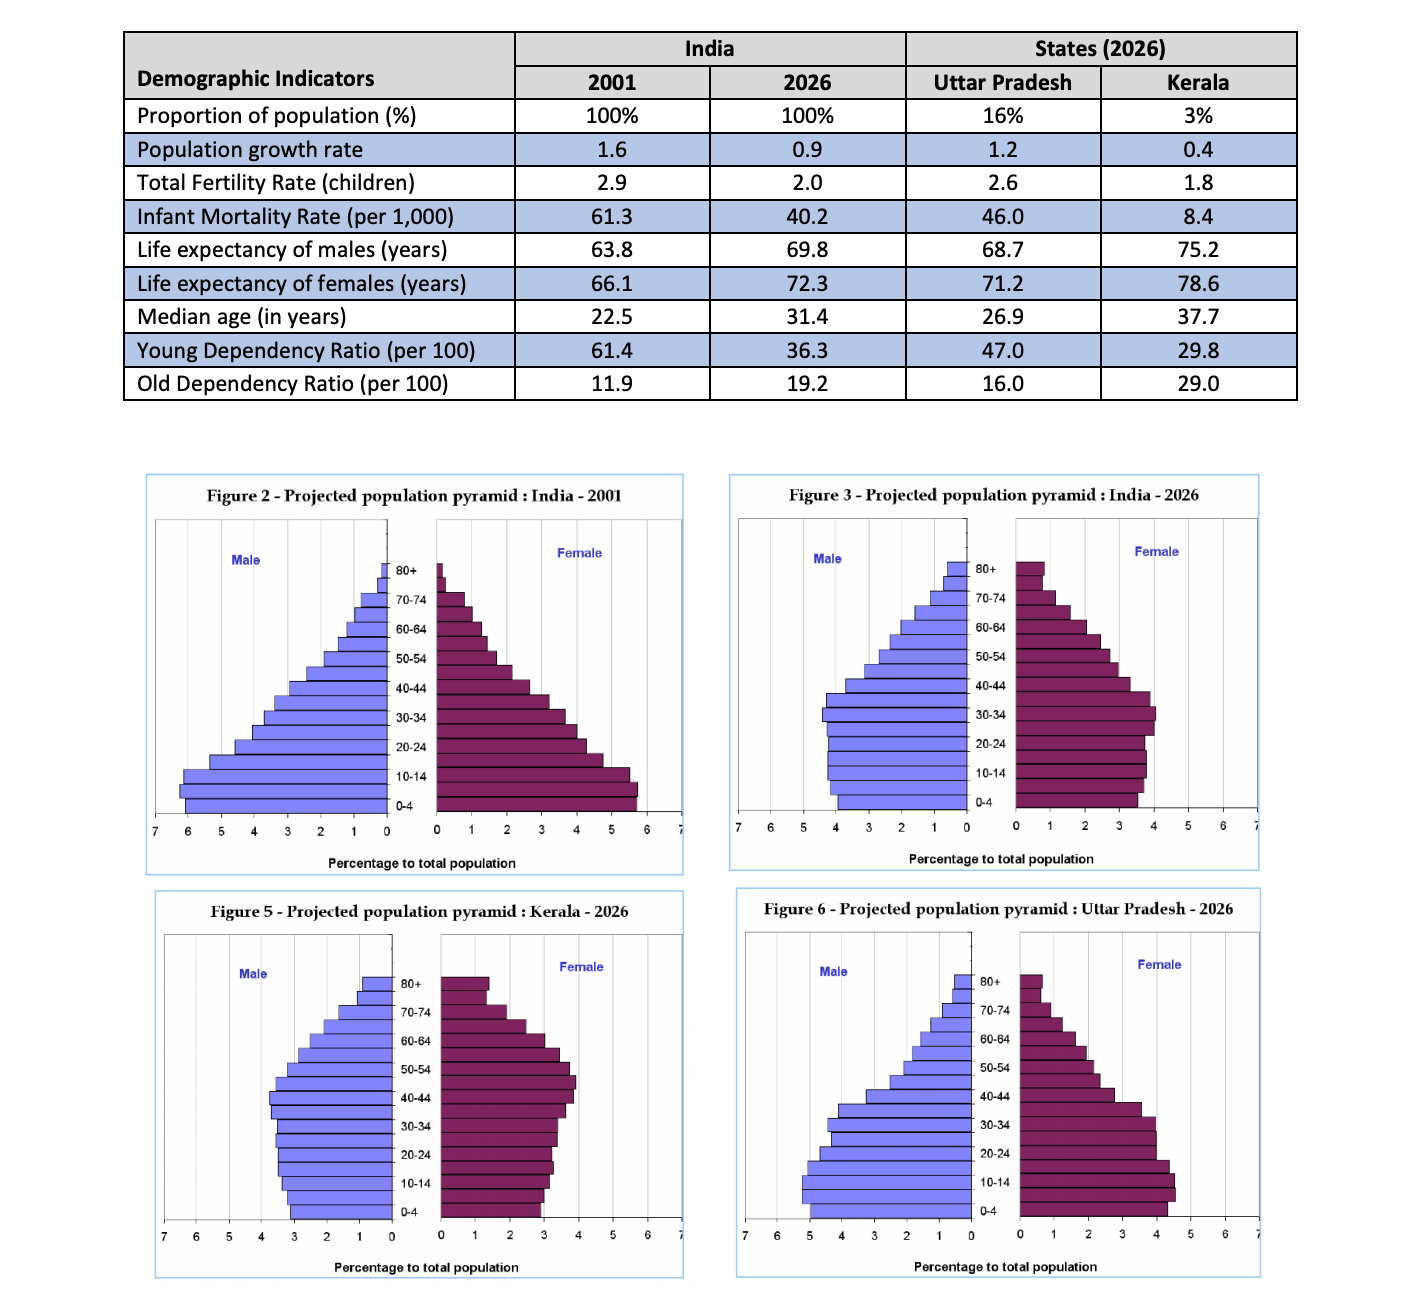
1.3. Using the figures of population pyramids:
a. Describe the changes in Indian age structures between 2001 and 2026.
b. Describe the main differences in age structures of Kerala and Uttar Pradesh in 2026.
c. Indicate what stages of demographic transitions (i.e. the first, second, third and fourth stages) for Indian population in 2001 and 2026, and for Kerala and Uttar Pradesh in 2026. Justify your answer.
1.4. Using the concept of direct and indirect population policies, please identify which population policies that could be properly applied in Kerala and in Uttar Pradesh. Explain your answers.
1.5. In your opinion, would India be able to have sustainable development? More specifically in the aspects of economic, social, and environmental sustainability.
INTRODUCTION: Profiles of Indian Population India is one of the most populated country in the world with nearly a fifth of the world's population. According to UN data, India's population is estimated at 1.38 billion people by mid-year or June 30, 2020. It is expected that the Indian population will continue to grow and reach an estimated 1.68 billion on December 31, 2050. By then, the country will become the world's most populous country to overtake China's population. Geographically, India is the 7th largest country in the world with a distinct geographical entity. The country is directly India bordered with seven countries: China and Nepal in the north, States and Union Territories Himachal State Capital Sri Lanka in the south, Bangladesh, Bhutan, and Myanmar on simus O Chand Union Territory Capital Punjab . Petraten Uttarakhand the east and Pakistan on the west. Significant proportions of Haryana Dell Pradesh overseas migration have been immigrants from Bangladesh. Sikkim OLucknow Uttar Pradesh Assam Nagaland Biha Meghalay Manipur As a country with 28 states and 8 territories, India has great Bhopal Madhy Jharkhand Mizoram jujarat Rankcha Bengal regional diversity which includes t the multi-ethnic Daman Chhattisgarh Derun Nagar Ha Odisha backgrounds, religions (dominated by Hindu) and Maharashtra Telangana demographic indicators. Hyderabad Goa Arabia Karnataka Pradesh Demographically, Uttar Pradesh is the most populous state Ochem BAK Of Bengaluru with almost 200 million people and Sikkim is the least Kerala Indaman populous state with 607,688 people. Mumbai and Delhi are Lakshadweep Nicobar Island the top two most populous cities with the total of 12.5 million Ocean and 11 million people, respectively. The following table and figures present demographic profiles of India and its two states (Uttar Pradesh and Kerala) in 2001 and 2026. It includes the county's levels of demographic components (i.e. fertility and mortality) and the population pyramids.India States (2026 Demographic Indicators 2001 2026 Uttar Pradesh Kerala Proportion of population (%) 100% 100% 16% 3% Population growth rate 1.6 0.9 1.2 0.4 Total Fertility Rate (children) 2.9 2.0 2.6 1.8 Infant Mortality Rate (per 1,000) 1.3 40.2 46.0 3.4 Life expectancy of males (years 53.8 69.8 68.7 75.2 Life expectancy of females (years) 66.1 72.3 71.2 78.6 Median age (in years 12.5 31.4 26.9 37.7 Young Dependency Ratio (per 100) 51.4 36.3 47.0 29.8 Old Dependency Ratio (per 100) 11.9 19.2 16.0 29.0 Figure 2 - Projected population pyramid : India - 2001 Figure 3 - Projected population pyramid : India - 2026 Male Female Male Female 80- 80+ 70-74 70-74 60-64 60-64 50-54 50-54 40-44 40-44 30-34 30-34 20-24 20-24 10-14 10-14 0-4 0-4 7 6 5 3 2 1 0 0 1 2 3 5 0 0 Percentage to total population Percentage to total population Figure 5 - Projected population pyramid : Kerala - 2026 Figure 6 - Projected population pyramid : Uttar Pradesh - 2026 Male Female Male Female 804 80+ 70-74 70-74 60-64 60-64 50-54 50-54 40-44 40-44 30-34 30-34 20-24 20-24 10-14 10-14 0-4 0-4 6 0 0 2 3 6 1 2 Percentage to total population Percentage to total populationQUESTIONS: 1.1. Having read the profiles of Indian population, please identify and explain what are the possible population challenges that can be faced by India, today and in the future? 1.2. Indian population growth (note: use the exponential growth equation). a. Estimate the annual population growth rate in India between the period 30 June 2020 and 31 December 2050. b. Estimate the population size of India on 30 June 2075, with the assumption if after 31/12/2050 the population grows continuously at the same rate as in the periods 2020-2050.1.3. Using the figures of population pyramids: a. Describe the changes in Indian age structures between 2001 and 2026. b. Describe the main differences in age structures of Kerala and Uttar Pradesh in 2026. C. Indicate what stages of demographic transitions (i.e. the first, second, third and fourth stages) for Indian population in 2001 and 2026, and for Kerala and Uttar Pradesh in 2026. Justify your answer. 1.4. Using the concept of direct and indirect population policies, please identify which population policies that could be properly applied in Kerala and in Uttar Pradesh. Explain your answers. 1.5. In your opinion, would India be able to have sustainable development? More specifically in the aspects of economic, social, and environmental sustainability


