Answered step by step
Verified Expert Solution
Question
1 Approved Answer
1.1 Illustrate and describe a few examples of frequency distribution curves. [10] 1.2 Make use of your own figures and explain how an average and

1.1 Illustrate and describe a few examples of frequency distribution curves. [10] 1.2 Make use of your own figures and explain how an average and a standard deviation are calculated. [10] 1.3 Describe the steps that would be followed in applying the brainstorming technique. [10] 1.4 Illustrate and write brief notes on the following "tools" that could be used when investigating quality: Pareto curve. [10] Fishbone diagram. [10]
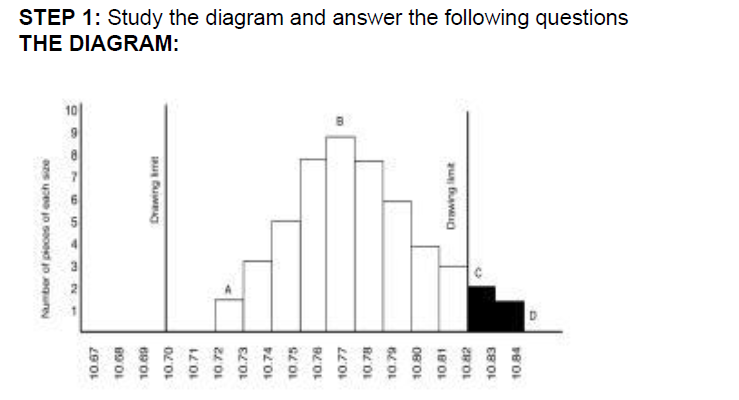
STEP 1: Study the diagram and answer the following questions THE DIAGRAMStep by Step Solution
There are 3 Steps involved in it
Step: 1

Get Instant Access to Expert-Tailored Solutions
See step-by-step solutions with expert insights and AI powered tools for academic success
Step: 2

Step: 3

Ace Your Homework with AI
Get the answers you need in no time with our AI-driven, step-by-step assistance
Get Started


