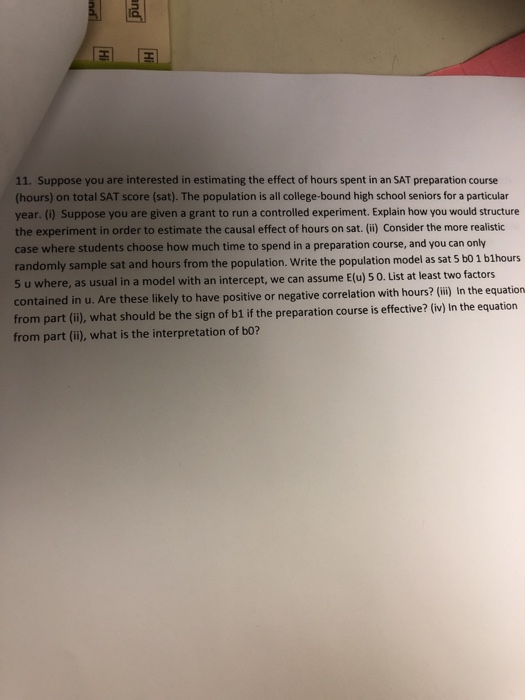
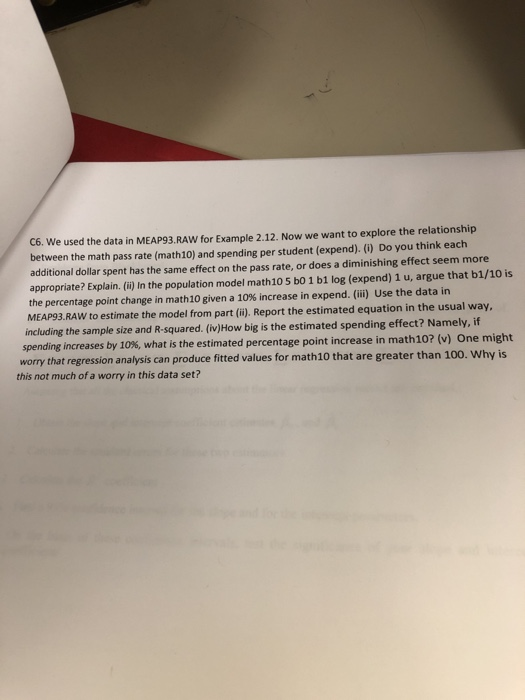
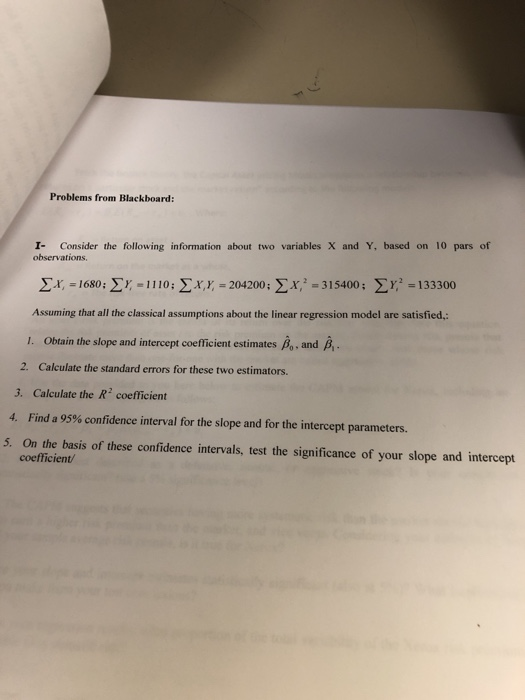
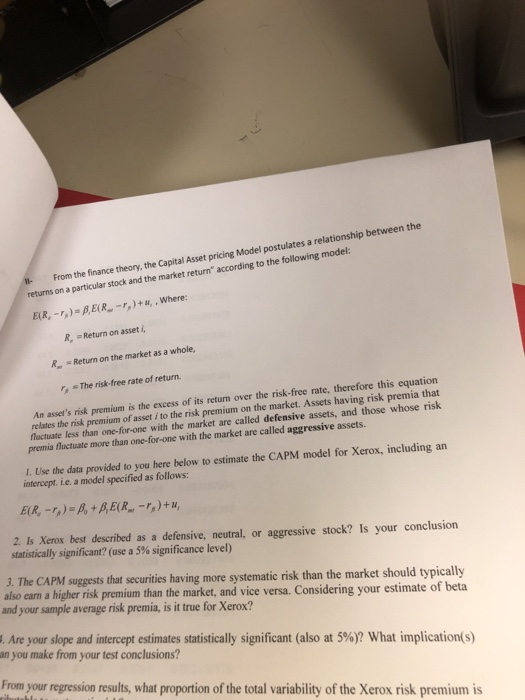
11. Suppose you are interested in estimating the effect of hours spent in an SAT preparation course (hours) on total SAT score (sat). The population is all college-bound high school seniors for a particular year. (i) Suppose you are given a grant to run a controlled experiment. Explain how you would structure the experiment in order to estimate the causal effect of hours on sat. (ii) Consider the more realistic case where students choose how much time to spend in a preparation course, and you can only randomly sample sat and hours from the population. Write the population model as sat 5 b0 1 blhours 5 u where, as usual in a model with an intercept, we can assume E(u) 5 0. List at least two factors contained in u. Are these likely to have positive or negative correlation with hours? (i) In the equation from part (i), what should be the sign of b1 if the preparation course is effective? (v) in the equation from part (ii), what is the interpretation of bo? C6. We used the data in MEAP93.RAW for Example 2.12. Now we want to explore the relationship between the math pass rate (math10) and spending per student (expend).() Do you think each additional dollar spent has the same effect on the pass rate, or does a diminishing effect seem more appropriate? Eplain. (i) In the population model math10 5 b0 1 b1 log (expend) 1 u, argue that b1/10 is the percentage point change in math 10 given a 10% increase in expend. (iii) Use the data in MEAP93 RAW to estimate the model from part (i), Report the estimated equation in the usual way. including the sample size and R-squared. (iv)How big is the estimated spending effect? Namely, if spending increases by 10%, what is the estimated percentage point increase in math 107(v) worry that regression analysis can produce fitted values for math10 that are greater than 100. Why is this not much of a worry in this data set? One might Problems from Blackboard: I- Consider the following information about two variables X and Y, based on 10 pars of observations X, =1680:57:=1110; , =204200; 2-315400 ; ,2=133300 Assuming that all the classical assumptions about the linear regression model are satisfied, 1. Obtain the slope and intercept coefficient estimates , and A. 2. Calculate the standard errors for these two estimators. 3. Calculate the R2 coefficient 4. Find a 95% confidence interval for the slope and for the intercept parameters. 5. On the basis of these confidence intervals, test the significance of your slope and intercept coefficient From the finance theory, the Capital returns on a particular stock and the market Asset pricing Model postulates a relationship between the return" according to the following model: R, Return on asset , R, -Return on the market as a whole, The risk-free rate of return. An asset's risk premium is the excess of its return over the risk-free rate, therefore this equation relates the risk premium of asset i to the risk premium on the market. Assets having risk premia that luctuate less than one-for-one with the market are called defensive assets, and those whose risk premia fluctuate more than one-for-one with the market are called aggressive assets. 1. Use the data provided to you here below to estimate the CAPM model for Xerox, including an intercept. i.c. a model specified as follows: 2. Is Xerox best described as a defensive, neutral, or aggressive stock? Is your conclusion statistically significant? (use a 5% significance level) 3. The CAPM suggests that securities having more sys also earn a higher risk premium than the market, and vice versa. Considering your estimate of beta and your sample average risk premia, is it true for Xerox? stematic risk than the market should typically . Are your slope and intercept estimates statistically significant (also at 5%)? What implication(s) an you make from your test conclusions? From your regression results, what proportion of the total variability of the Xerox risk premium is