

Answered step by step
Verified Expert Solution
Question
1 Approved Answer
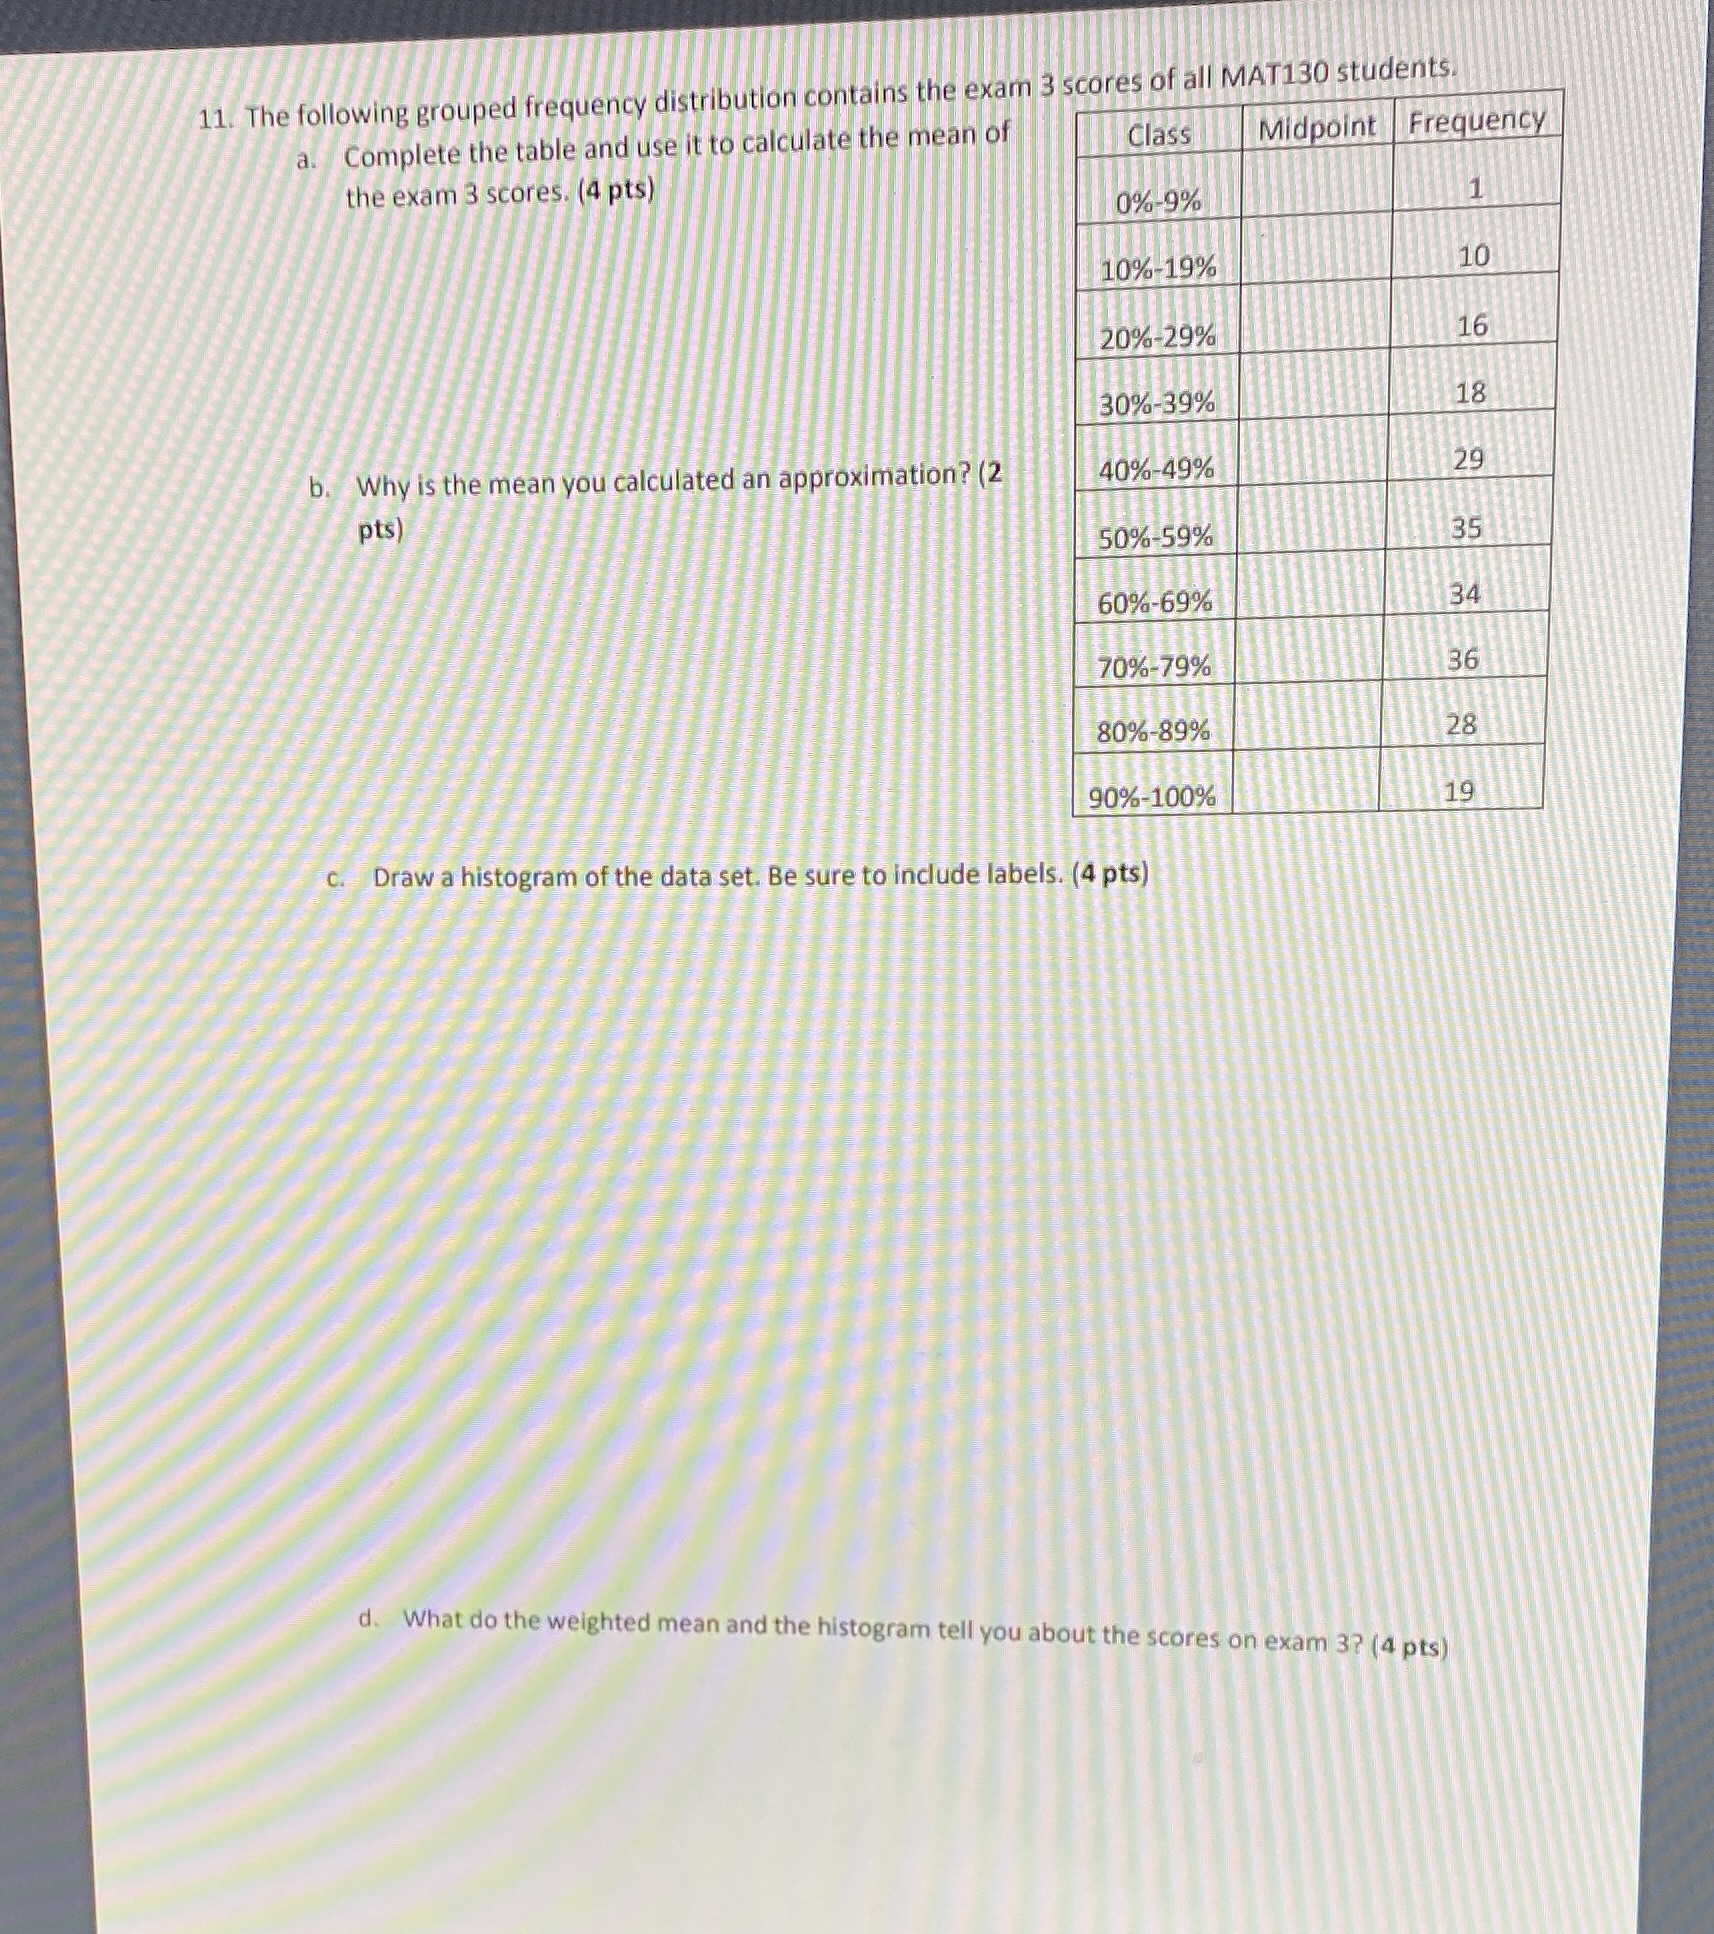
11. The following grouped frequency distribution contains the exam 3 scores of all MAT130 students. a. Complete the table and use it to calculate the
Step by Step Solution
There are 3 Steps involved in it
Step: 1

Get Instant Access to Expert-Tailored Solutions
See step-by-step solutions with expert insights and AI powered tools for academic success
Step: 2

Step: 3
Ace Your Homework with AI
Get the answers you need in no time with our AI-driven, step-by-step assistance
Get Started
Geometry And Analysis Of Fractals Hong Kong, December 2012
Authors: De Jun Feng, Ka Sing Lau
1st Edition
3662439204, 9783662439203