Question
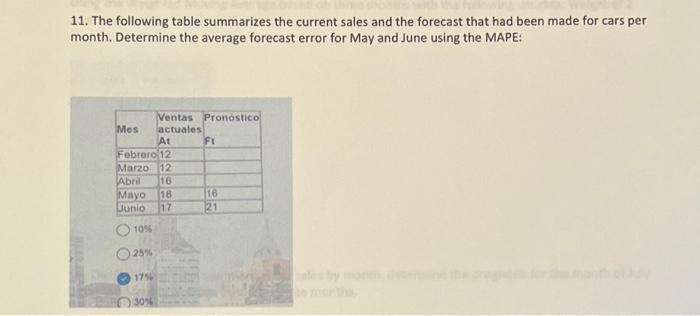
11. The following table summarizes the current sales and the forecast that had been made for cars per month. Determine the average forecast error

11. The following table summarizes the current sales and the forecast that had been made for cars per month. Determine the average forecast error for May and June using the MAPE: Mes At Febrero 12 Marzo 12 Abril 16 Mayo 18 Junio 17 10% 25% OOO Ventas Pronstico actuales 17% 30% 687 Ft 16 21
Step by Step Solution
3.39 Rating (155 Votes )
There are 3 Steps involved in it
Step: 1
Answer Correct Option C 17 Explanation Mean absolute percentage error ...
Get Instant Access to Expert-Tailored Solutions
See step-by-step solutions with expert insights and AI powered tools for academic success
Step: 2

Step: 3

Ace Your Homework with AI
Get the answers you need in no time with our AI-driven, step-by-step assistance
Get StartedRecommended Textbook for
Accounting for Decision Making and Control
Authors: Jerold Zimmerman
9th edition
125956455X, 978-1259564550
Students also viewed these Accounting questions
Question
Answered: 1 week ago
Question
Answered: 1 week ago
Question
Answered: 1 week ago
Question
Answered: 1 week ago
Question
Answered: 1 week ago
Question
Answered: 1 week ago
Question
Answered: 1 week ago
Question
Answered: 1 week ago
Question
Answered: 1 week ago
Question
Answered: 1 week ago
Question
Answered: 1 week ago
Question
Answered: 1 week ago
Question
Answered: 1 week ago
Question
Answered: 1 week ago
Question
Answered: 1 week ago
Question
Answered: 1 week ago
Question
Answered: 1 week ago
Question
Answered: 1 week ago
Question
Answered: 1 week ago
View Answer in SolutionInn App


