

Answered step by step
Verified Expert Solution
Question
1 Approved Answer
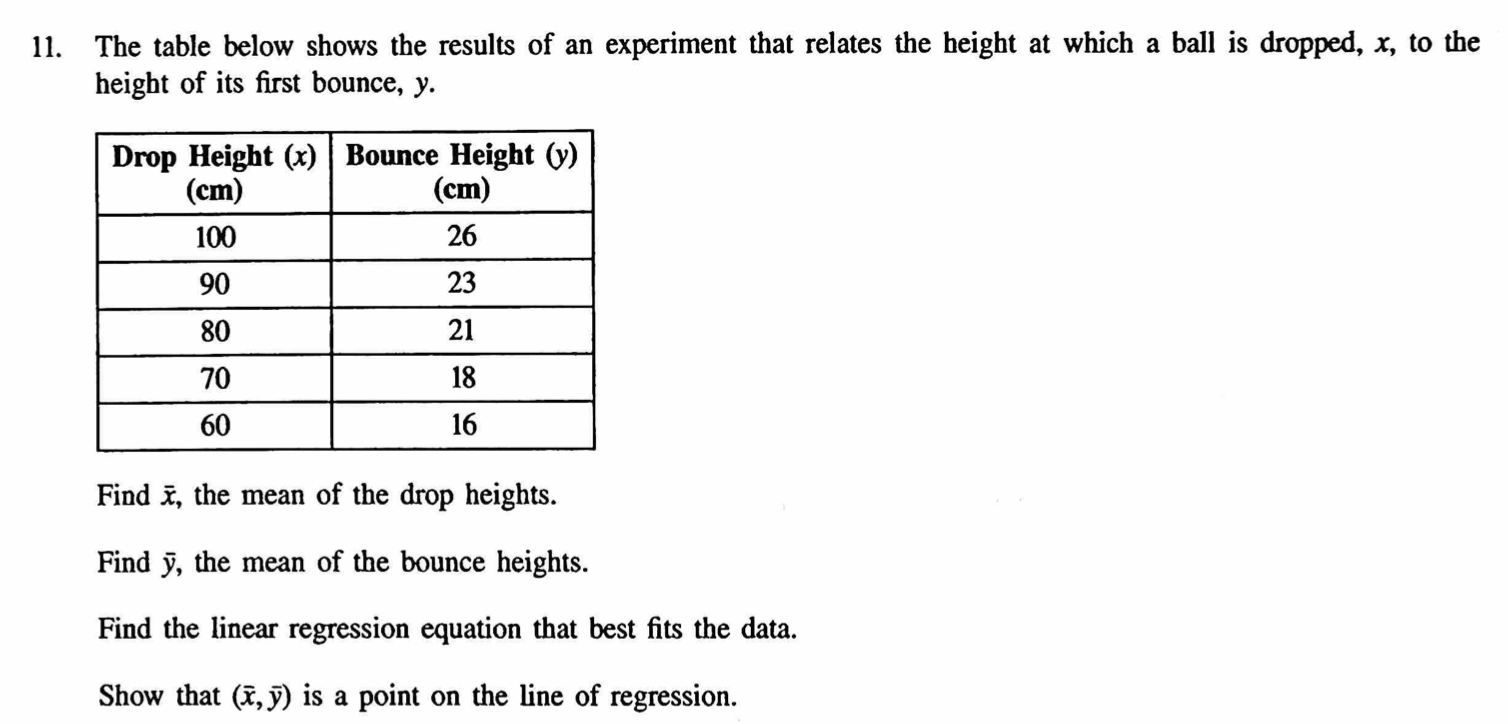
11. The table below shows the results of an experiment that relates the height at which a ball is dropped, x, to the height of

Step by Step Solution
There are 3 Steps involved in it
Step: 1

Get Instant Access to Expert-Tailored Solutions
See step-by-step solutions with expert insights and AI powered tools for academic success
Step: 2

Step: 3
Ace Your Homework with AI
Get the answers you need in no time with our AI-driven, step-by-step assistance
Get Started
Real Analysis For The Undergraduate With An Invitation To Functional Analysis
Authors: Matthew A Pons
1st Edition
1461496381, 9781461496380