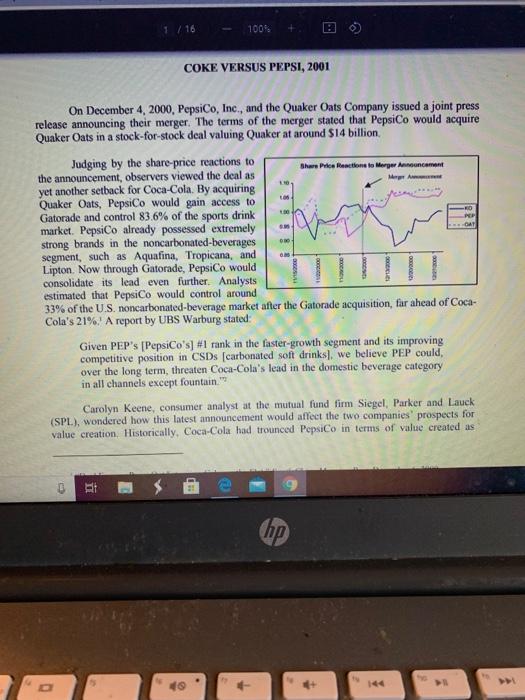
111 100% + si Case (1).pdf Coke versus Pepsi Case study: Please note that even though it is a team exercise, and you will be tempted to divide and conquer, it is extremely important that every member fully understands all aspects. If not, you will have partial learning and may struggle in the future courses. I Conduct an in-depth financial analysis: Note, first three questions are based on data in the case. The last two questions are based on using more current data (use Mergent data base) 1 EVA Analysis: Examine the historical performances of Coca-Cola and PepsiCo in terms of EVA; formula provided in the case study (Note: NOPAT is same as EBITAT or EBIT (1-tax rate). a. You should look under the hood, who is driving the EVA to be better or worse. For example EBIT is driven by parameters like Sales, operating costs, and thus operating margins, etc 2. Using Financial ratios from the case: Examine the historical financial ratios, provide comparison and again look at the elements of the numerator and denominator of the ratios 3. Using your analysis in (1) and (2), which company would you chose? a Extremely important that you support this answer with quantitative analysis, Le.. provide financial and analytical evidence to support your conclusions A. Now look at recent financial performance of these two companies, using Mergent data site on Bay Path Wbrary and provide your analysis of which company would up pick and why Does your company selection differ between prior data from the case and more recent data? Support your conclusions e hip 1/16 100% COKE VERSUS PEPSI, 2001 Share Price Reaction to Merger Anna On December 4, 2000, PepsiCo, Inc., and the Quaker Oats Company issued a joint press release announcing their merger. The terms of the merger stated that PepsiCo would acquire Quaker Oats in a stock-for-stock deal valuing Quaker at around $14 billion Judging by the share-price reactions to the announcement, observers viewed the deal as yet another setback for Coca-Cola. By acquiring Quaker Oats, PepsiCo would gain access to Gatorade and control 83.6% of the sports drink market. PepsiCo already possessed extremely strong brands in the noncarbonated-beverages segment, such as Aquafina, Tropicana, and Lipton. Now through Gatorade, PepsiCo would consolidate its lead even further. Analysts estimated that PepsiCo would control around 33% of the U.S. noncarbonated-beverage market after the Gatorade acquisition, far ahead of Coca- Cola's 21%. A report by UBS Warburg stated: Given PEP's (PepsiCo's] #1 rank in the faster-growth segment and its improving competitive position in CSDs (carbonated soft drinks), we believe PEP could, over the long term, threaten Coca-Cola's lead in the domestic beverage category in all channels except fountain." Carolyn Keene, consumer analyst at the mutual fund firm Siegel, Parker and Lauck (SPL), wondered how this latest announcement would affect the two companies prospects for value creation Historically. Coca-Cola had trounced PepsiCo in terms of value created as hp 0 Jers/celes/Downloads/Coke%20v%20Pepsi.pdf 2001 2 16 In 2000, the Coca-Cola Company's (ticker symbol: KO) annual sales were $20.5 billion, and its market value reached $110.1 billion. The company was the largest manufacturer, distributor, and marketer of soft-drink concentrates and syrups in the world. It also marketed and distributed a variety of noncarbonated-beverage products, which included Minute Maid orange juice, Fruitopia, Dasani bottled water, and Nestea, among others. From 1993 to 1998, the Coca-Cola Company had consistently gamered the first or second spot in Fortune's annual ranking of the top wealth creators. One of the main reasons for this was the company's strategy of spinning of its bottling operations to avoid consolidation on its balance sheet. This move, implemented in 1985, contributed to a dramatic rise in returns on equity from 23% to as much as 57% over the last two decades (Exhibit) Recently, however, the company had run into difficulties. The Asian financial crisis, South America's difficulties, and Russia's devaluation of the ruble all hurt KO. But business mistakes by Doug Ivester, CEO from 1997 to 1999, aggravated the situation An example of one such mistake occurred in November 1999, when M. Douglas Ivester CEO of Coca-Cola, instituted a 7.7% price hike on syrup, a rate that was double that of the usual increases. The Coca-Cola Company's bottles were infuriated, and felt that Ivester was gouging them in order to increase KO's profits. In response, the bottles raised prices for the first time in years to improve profitability, resulting in a decrease in volume (Exhibit 3). During Ivester's approximately two-year term, net income fell by 41%. The company's board of directors eased Ivester out in December 2000 Douglas Dalt, head of Coca-Cola's Middle and Far East and Africa groups, was chosen to succeed Ivester. Upon taking over, Daft immediately instituted major organizational changes such as cutting staff and reducing burocracy. But perhaps the most important change was luis acknowledgment that KO needed to be a dominant player in the nocarbonated-beverages market. In contrast to lvester, who had insisted on pushing the company's core s-drink search 0 RI (hp * 4 5 5 6 & 7 8 9 R T T Y U 3/16 100% brands-Coca-Cola, Fanta, Sprite, and Diet Coke-Daft and his executives worked hard to come up with new, noncarbonated products. Some analysts were optimistic that the change in management would return the Coca- Cola Company to its glory days. Perhaps through improved relations with bottlers and acquisitions of noncarbonated beverages, KO would return to the pre-1998 profit margins. Other analysts were less enthusiastic One thing was certain, however, with PepsiCo's invigorated management, KO would need to get back on its feet as quickly as it could Company Background: PepsiCo, Ine. In 2000, PepsiCo, Inc., was a $20 billion company involved in the snack food, soft drink, and noncarbonated beverage businesses. The company sold and distributed salty and sweet snacks under the Frito Lay trademark and manufactured concentrates of Pepsi, Mountain Dew, and other brands to sell to franchised bottlers. The company also produced and distributed juices and other noncarbonated beverages Snack foods accounted for roughly two-thirds of PepsiCo's sales and operating income, while beverages accounted for the remainder Positioning PepsiCo as a focused snack-and-beverage company in 2000 was due mostly to the efforts of Roger Enrico, CEO from 1996 to 2000. During his tenure, Enrico instituted a massive overhaul at PepsiCo. In 1997, he sold off the fast-food chains KFC, Taco Bell and Pizza Hut, ridding PepsiCo of a business that had long been a drag on returns. In 1999, he spun off Pepsi's capital-intensive bottling operations into an independent public company. By spinning of the bottling operations, PepsiCo would be left with just the higher-margin business of selling concentrate to bottlers. At the same time, independent PepsiCo bottlers would be able to raise capital on their own, freeing up cash flow within the parent company for other uses. Enrico also took aggressive steps to make PepsiCo a total beverage company. He brokered the acquisitions of Tropicana, the market leader in orange juice, and Ouaker Oats, whose Gatorade brand dominated the energy-drink market nanum Punit man hp 2 $ 08 3 5 6 7 8 9 O E 20 T Y 1 Industry Overview and Competitive Events In 2000, the beverage industry was undergoing a rapid transformation: the noncarbonated drinks segment, although still representing only a small fraction of the beverage market, had grown by 62% in volume over the last five years, while soft-drink-volume growth had been sluggish. According to Beverage Digest, the share of the carbonated soft drink industry fell from 71.3% in 1990 to 60.5% in 2000 In soft drink volume, PepsiCo still laggod behind Coke, although it seemed to have caught up somewhat in recent years (Exhibit 3). In the fall of 1999, for instance, PepsiCo, for the first time in its history, Occupied two of the top three places for US soft-drink brands on store shelves as its Mountain Dew dislodged Diet Coke from third place Recent developments at both companies signaled an aggressive new round of competition. Below is a summary of recent competitive moves by both companies in several beverage categories Soft drinks Over the last five years, Pepsi had launched aggressive and exciting marketing campaigns (eg, "Generation Next. "Joy of Pepsi) that helped boost volume and visibility. In addition, Pepsi launched the "Power of One" campaign-a strategy that entailed moving Pepsi drinks next to Frito Lay chips on store shelves to entice shoppers to pick up a Pepsi when they bought chips. This strategy also helped boost both Frito-Lay and Pepsi's volumes. In response to the success of the Pepsi campaigns, in the summer of 2000, Coca-Cola tesorted to a number of tactics, such as veering away from its traditional feel good ads and launching trendier ones. Unfortunately, the new ads were highly unpopular and clicited negative reactions from customers and bottlers! Coca-Cola pulled the ads and replaced them with the Life Tastes Good" series, which marked a return to Coke's traditional "feel-good" themes, while being trendy at the same time Noncarbonated beverages ca E e hp 4 5 6 N 00 9 O E R. T Y U o P 72 F G H K L Company Background: PepsiCo, Inc. In 2000, PepsiCo, Inc., was a $20 billion company involved in the snack food, soft drink, and noncarbonated beverage businesses. The company sold and distributed salty and sweet snacks under the Prito-Lay trademark and manufactured concentrates of Pepsi, Mountain Dew, and other brands to sell to franchised bottlers. The company also produced and distributed juices and other noncarbonated beverages. Snack foods accounted for roughly two-thirds of PepsiCo's sales and operating income, while beverages accounted for the remainder Positioning PepsiCo as a focused snack-and-beverage company in 2000 was due mostly to the efforts of Roger Enrico, CEO from 1996 to 2000. During his tenure, Enrico instituted a massive overhaul at PepsiCo, In 1997, he sold off the fast-food chains KFC, Taco Bell, and Pizza Hut, ridding PepsiCo of a business that had long been a drag on returns. In 1999, he spun off Pepsi's capital-intensive bottling operations into an independent public company. By spinning off the bottling operations, PepsiCo would be left with just the higher-margin business of selling concentrate to bottlers. At the same time, independent PepsiCo bottlers would be able to raise capital on their own, freeing up cash flow within the parent company for other uses. Enrico also took aggressive steps to make PepsiCo a "total beverage company. He brokered the acquisitions of Tropicana, the market leader in orange juice, and Quaker Oats, whose Gatorade brand dominated the energy-drink market. During Enrico's term, PepsiCo's return on equity almost doubled, from 17% in 1996 to 30% in 2000. (See Exhibit 2 for historical returns and Exhibit I for a historical EVA analysis.) On Wall Street, analysts were upbeat about PepsiCo's prospects 0 . g hp $ 4 5 6 & 7 8 9 O 100% brands-Coca-Cola, Fanta, Sprite, and Diet Coko-Daft and his executives worked hard to come up with new, noncarbonated products Some analysts were optimistic that the change in management would return the Coca- Cola Company to its glory days. Perhaps through improved relations with bottlers and acquisitions of noncarbonated beverages, KO would return to the pre-1998 profit margins. Other analysts were less enthusiastic. One thing was certain, however, with PepsiCo's invigorated management, KO would need to get back on its feet as quickly as it could Company Background: PepsiCo, Inc. In 2000, PepsiCo, Inc., was a $20 billion company involved in the snack food, soft drink, and noncarbonated beverage businesses. The company sold and distributed salty and sweet snacks under the Frito-Lay trademark and manufactured concentrates of Pepsi, Mountain Dew and other brands to sell to franchised bottlers. The company also produced and distributed juices and other noncarbonated beverages * Snack foods accounted for roughly two-thirds of PepsiCo's sales and operating income, while beverages accounted for the remainder Positioning PepsiCo as a focused snack-and-beverage company in 2000 was due mostly to the efforts of Roger Enrico, CEO from 1996 to 2000. During his tenure, Enrico instituted a massive overhaul at PepsiCo In 1997, he sold off the fast-food chains KFC, Taco Bell, and Piana Hut, ridding PepsiCo of a business that had long been a drag on returns. In 1999, he spun off Pepsi's capital-intensive bottling operations into an independent public company. By spinning of the bottling operations, PepsiCo would be left with just the higher-margin business of selling concentrate to bottlers. At the same time, independent PepsiCo bottlers would be able to raise capital on their own, freeing up cash flow within the parent company for other uses. Enrico also took aggressive steps to make PopsiCo a total beverage company. He brokered the acquisitions of Tropicana, the market leader in orange juice, and Quaker Oats, whose Gatorade brand dominated the energy drink market latian min f hop + & $ 3 5 6 7 8 9 9 E R. T Y U 1 O P. 3 COKE VERSUS PEPSI, 2001 Downloads/Coke%20v%20Pepsi pdf 100% Noncarbonated beverages Coke and PepsiCo raced to position themselves in this important and fast growing market segment Orange juiceIn 1998, PepsiCo acquired Tropicana, the clear market leader in orange juice. Tropicana held more than 40% of the total chilled orange juice market and 70% of the not * McCarthy, Hufferte Coke's Mostle over Ouker "Ficom, November 25, 2000 John A lyopiCo's New Formula Hlow Roger Enrico is Remaking the Company Murid April 10, 2000 * The ads were prodoved the Cut Freeman Ad Agency, famous for its controversial do com a in which perbils were shown being shot out of a camion One Cole commercial featured a grandmother in a wheelchair to throws um when the discovers there is no Cokie stately reunion For the exclusive use of M. SANTA, 2021. UVOOR from-concentrate orange juice segment in the United States Coke's Minute Maid had less than 20% of the chilled orange juice market Baddress which hp : 4 96 5 6 7 00 9 0 R. T Y U 1 o P 3 TH G H K COKE VERSUS PEPSI, 2001 Bes/Downloads/Coke. 20Pepsi.pdf 1009 Bottled water. PepsiCo test marketed Aquafina as early as 1994, while Coke, with its Dasani brand, did not enter the bottled water market until 1999. Aquafina was the number one ranked bottled water brand in the US market in 2000 Iced tea: PepsiCo's Lipton boasted a 16-point share load over Coca-Cola's Nesten Sports drinks Pending the Federal Trade Commission's approval of the PepsiCo Quaker Oats deal, PepsiCo would own Gatorade, which held 83% of the US sports-drink market. Coca- Cola's Powerade was a distant second at 11% Specialty drink PepsiCo, in alliance with Starbucks, introduced the highly popular Starbucks Frappuccino in 1996. It took Coca Cola until 2000 to announce that it was going to test market a frozen coffee beverage. In October 2000, PepsiCo beat Coca-Cola in acquiring South Beach Beverage Company, maker of the Soe brand of teas and fruit juices Financial Comparison Analysts expected that the coming months would be among the most exciting in the Coke Pepsi saa. It would be interesting to see how the revived cola wars" would play out in the meantime, a look at some performance measures might provide clues as to what the future held Ratio analyse Exhibits and present a variety of analytical ratios computed from the financial statements of each firm Economic profil analysis. Also known as economic value-added, EVA can be used to estimate the value created or destroyed by comparing a firm's cash operating profits ar net operating profits after tax (NOPATI ainst a capital charge IVANOPAT (Weighted average cost of capital invested capital) Alternatively, the formula could be written as EVA - Return on invested capital - WACC) Invested enital (hp 14 $ 56 5 6 & 7 00 9 R. T T Y U 1 o P 1 Industry Overview and Competitive Events In 2000, the beverage industry was undergoing a rapid transformation: the noncarbonated drinks segment, although still representing only a small fraction of the beverage market, had grown by 62% in volume over the last five years, while soft-drink-volume growth had been sluggish. According to Beverage Digest, the share of the carbonated soft drink industry fell from 71.3% in 1990 to 60.5% in 2000 In soft drink volume, PepsiCo still laggod behind Coke, although it seemed to have caught up somewhat in recent years (Exhibit 3). In the fall of 1999, for instance, PepsiCo, for the first time in its history, Occupied two of the top three places for US soft-drink brands on store shelves as its Mountain Dew dislodged Diet Coke from third place Recent developments at both companies signaled an aggressive new round of competition. Below is a summary of recent competitive moves by both companies in several beverage categories Soft drinks Over the last five years, Pepsi had launched aggressive and exciting marketing campaigns (eg, "Generation Next. "Joy of Pepsi) that helped boost volume and visibility. In addition, Pepsi launched the "Power of One" campaign-a strategy that entailed moving Pepsi drinks next to Frito Lay chips on store shelves to entice shoppers to pick up a Pepsi when they bought chips. This strategy also helped boost both Frito-Lay and Pepsi's volumes. In response to the success of the Pepsi campaigns, in the summer of 2000, Coca-Cola tesorted to a number of tactics, such as veering away from its traditional feel good ads and launching trendier ones. Unfortunately, the new ads were highly unpopular and clicited negative reactions from customers and bottlers! Coca-Cola pulled the ads and replaced them with the Life Tastes Good" series, which marked a return to Coke's traditional "feel-good" themes, while being trendy at the same time Noncarbonated beverages ca E e hp 4 5 6 N 00 9 O E R. T Y U o P 72 F G H K L COKE VERSUS PEPSI, 2001 Bes/Downloads/Coke. 20Pepsi.pdf 1009 Bottled water. PepsiCo test marketed Aquafina as early as 1994, while Coke, with its Dasani brand, did not enter the bottled water market until 1999. Aquafina was the number one ranked bottled water brand in the US market in 2000 Iced tea: PepsiCo's Lipton boasted a 16-point share load over Coca-Cola's Nesten Sports drinks Pending the Federal Trade Commission's approval of the PepsiCo Quaker Oats deal, PepsiCo would own Gatorade, which held 83% of the US sports-drink market. Coca- Cola's Powerade was a distant second at 11% Specialty drink PepsiCo, in alliance with Starbucks, introduced the highly popular Starbucks Frappuccino in 1996. It took Coca Cola until 2000 to announce that it was going to test market a frozen coffee beverage. In October 2000, PepsiCo beat Coca-Cola in acquiring South Beach Beverage Company, maker of the Soe brand of teas and fruit juices Financial Comparison Analysts expected that the coming months would be among the most exciting in the Coke Pepsi saa. It would be interesting to see how the revived cola wars" would play out in the meantime, a look at some performance measures might provide clues as to what the future held Ratio analyse Exhibits and present a variety of analytical ratios computed from the financial statements of each firm Economic profil analysis. Also known as economic value-added, EVA can be used to estimate the value created or destroyed by comparing a firm's cash operating profits ar net operating profits after tax (NOPATI ainst a capital charge IVANOPAT (Weighted average cost of capital invested capital) Alternatively, the formula could be written as EVA - Return on invested capital - WACC) Invested enital (hp 14 $ 56 5 6 & 7 00 9 R. T T Y U 1 o P 1 > CON VERSUS PEPSL 2001 cele Downloads 100N Financial Comparison Analysts expected that the coming months would be among the most exciting in the Coke Pepsi saga It would be interesting to see how the revived "cola wars" would play out in the meantime, a look at some performance measures might provide che as to what the future held Rational Exhibits 4 and 5 present a variety of analytical ratios computed from the financial statements of each firm. Economic profirana Also known as economic value-added, EVA can be used to estimate the value created or destroyed by comparing a firm's cash operating profits or net operating profits after tax (NOPAT) against a capital charge EVA - NOPAT (Weighted average cost of capital invested capital) Alternatively, the formula could be written as EVA - (Return on invested capital WACC)Invested capital Return on invested capital (ROC), as the name suggests could be calculated by dividing NOPAT by invested capital. The second formula highlights the idea that aproad" cared beyond a company's cost of capital results in value creation "WACC 2:15 422/2 hp + $ 4 3 5 6 & 7 C 9 8 o E R T Y U o P t > COKE VERSUS PE 2001 /DownloadCowoops 1001 For the exclusive use of M. SANTA, 2021. UVON Conclusion Coke and Pepsi had created one of the strongest rivalries in the story. Carolyn Keene now wanted to develop a view what the two companies are performances. She obtained pro forma projections for the two fimm from reports prepared by analyst Credit Suisse First Weston (Exhibits 6 and 7), and gathered information about our capital market conditions Exhibit). She also took out her gosdelines for estimating the components EVA Exhibit li would be nice to finish her analysis before going off for Christmas hak 9:35 AM A: E e hp 5 4 90 5 6 & 7 00 9 o R T COKE VERSUS PEPSL 2001 /Downloads/Coke%20v%20Peps.pdf 12 / 16 100% CORE VERSUS METSZOT Income-Statement and Balance Sheet Forecasts for Coca-Cola Halone 22.50 Cheval 5285 6612 MN 2013 20334 CES Ne posting Cost of goods Crows pola 2,06 1.910 2.419 304 14131 15. 16 103 1. 7.50 7.5 1959 Gold 124 1211 333 18 2.4 Torrent in bon Marbeit ME Le depreciation NAI Keluh T 592 2.4 7.334 (2013 Uw 21 6.40 2. H TI 4 . 244 295 OM 107 254 CH 261 4 141 AN con qy heim Pino 6.14 3. 300 154 APA be Comme Acom Tesis 3.500 151 734 1.400 7 2013 . 44 MI 136 WI app format he den T 107 167 30 191 295 10 TH 2010 70 Lud HO 2 . 23 000 115 367 for accumulated throw 100 Hd Video, www Des de CSI 2001 DI hp 40 S 4 5 6 & 7 8 9 T P 11 / 16 100% Exhibit 5 COKE VERSUS PEPSI, 2001 Analytical Financial Ratios for PepsiCo, Inc 7661 1995 19 1997 361 1999 2000 Activity Anahi Avere days olding Working capital turnover Find somover Total cover 2533 (14.07 164 26.89 513.67 1.72 1.30 22.19 2008 182 127 40.71 20.98 1.42 37.59 (2869) 1.57 IOS 3725 (12.56) 155 3128 38.78 205 114 10 1 90 Liquidity Analysis Carreto Cahatin Cash from operation to 106 0.29 0.72 100 0.15 0.62 1.47 0.69 OSO 0:55 0.05 041 1.10 0.28 O.NO 1.17 0.34 0.99 0.71 0.71 557 Long Term Debt and solvency Analysis Deity Time interest Gamed Freddare aveti Capital expenditure Cash from periode 1.39 445 103 165 0.39 1.73 43 2.72 1.78 0.10 197 434 248 1.33 012 1.24 654 3.00 2.39 0.00 0.44 7.75 3.73 2.71 0.99 0:35 14.59 436 167 160 327 0.69 NO Profitability Analysis Openingar Napoli HOA RON Taillefest IN 6:29 711 2411 54% * SVE M 127) 10. N 16.95 451 11.69 29 2.1 33 10194 10,29 15. 10.94 122 290 32.14 NIN WTS 230 53 300 054 77.11 Growth Sales 11 SU 3 UNE 63 127 -22 0.14 454 6.11 Ne mobilis NOPAT 2016 -In -7 - 121 10.15 2 -14 -2.5 14 409 SP -70% 2.1 2.11 On 119 144 ONUN. hp $ 4 5 9 & 7 8 9 Exhibit 4 COKE VERSUS PEPSI, 2001 Analytical Financial Ratios for the Coca-Cola Company 1995 1997 1998 6661 2000 Activity Analysis Avere days outstanding Working capital turnover Fixed acts over Total se tumover 3124 (1633) 3.50 1.08 31.71 (6.52) 32.61 (11.17) 3.60 1.12 32.83 (1062) 3.87 1.15 31.73 (890) 4.13 112 32.06 (6.14) 436 31.92 (5.49) 1.79 105 091 0.59 080 075 Liquidity Analysis Current ratio Cash ratio Cash from operations to 0.64 0.25 0:54 0.16 0.21 0.87 0.18 0.35 0.90 0.18 0.39 0.87 0.30 0.38 0.47 0:47 Long Term Debt und Solvency Analysis Det er to Times interest comed frudharyotage Capital expendituremat Cash from operations de train 067 18.63 10.03 0.61 19 18 0.75 140 9.87 3.55 02 0.73 130 7.13 350 0.77 8.99 0.65 17.93 8.70 198 055 0.65 1182 60 3.63 0.62 8.36 5.77 4.89 0.63 RT 69 0.6 0.78 Profitability Analysis Operating margin Net profit may ROA RE 154 16. 23:35 I. 1774 2119 IN 1919 51.7 265% 21.99 2119 40 2641 188 229% 46.19 2. 20.1% 123 17.34 37.1% TRON 1067 IN 25. 61 MET 10.15 TI 15.99 15. 167 2. 149 179 45 12 34 1349 -14 31 129 . 16.9% Growth S Book Net noe hele ANOPAT Netice Opng . -16 -1046 100 16 16. -1444 114 1955 IR 277 -1939 - -1 NEC p hp 49 4 96 5 6. & 7 8 9 2 Downloads/Cok s%20Pepsi.pdf 13/16 100 COKE VERSUS PEPSI, 2001 Income-Statement and Balance Sheet Forecasts for PepsiCo Peplice MESSA IK 2016 11.307 Rev Beverages Fry Der Tode 2003 13.116 1607 10343 14 041 27.00 444 1,141 1ATT 44 4141 7,497 186 2,73 100 379 MU 2 3415 1,164 Opto Bever AK, help Other Tech 2 Ses 1.49 1.000 IMN UI 2015 4,42 1.469 2679 40 11 JAPAI Data Swag Corpo LAN 40 010 455 M 4.18 7400 4.56 2.995 90 CHE aff 4 1,414 3. 25714 BIT 92 IM 197 31 239 NI 499 S.STI Com | als Tel. 30 SAT 13 210 Net 2013 316 1803 4.41 4x10 Jo Tui 14. HI 950 Ir Am 23 1.140 1341 ch 1. 1.100 M 23.30 VI1,034 2014 TES Thermal 21 Soute den for depreciation wind.com odwill amount "A Balanced Formula for Growth by Andrew Coway, Chris O'Donnell, and Corey Honch Credit Sunne Fint Hoston quity Research, November 82001 it hp 5 6 7 CO 9 O %20v-%20Pepsi.pd! 100% -14- UV0008 Exhibit 8 COKE VERSUS PEPSI, 2001 Capital-Market Information on December 4, 2000 Call Shoes SA Juary 1991 December 4, 2000 sen 5.79 3.5 3 25 2 15 1 05 0 The Case Company Poplar Lates 113 2008 Chi MES AL AD 199 1903 19 IT OV 21 $ hip 20%20Pepsi.pdf 15 / 16 100% Exhibit 9 COKE VERSUS PEPSI, 2001 Some Guidelines for Estimating Components of EVA NOPAT. Net operating profit after taxes (NOPAT) is calculated with the aim of arriving at the actual cash generated by the concern. Adjustments might include adding back goodwill amortization and other noncash expenses. Taxes must similarly be adjusted to reflect only actual cash taxes. Depreciation is not added back to NOPAT despite being a noncash expense, because of the assumption that depreciation represents a true economic cost (.e., it is the amount that must be reinvested to maintain operations at the existing level). For consisteney, invested capital is measured net of depreciation lavested capital. Invested capital means, simply, the amount of capital invested in the business. It may be calculated either from the asset side or from the liabilities + equity side of the balance sheet. The latter is the simpler method. Invested capital includes debt, equity, and other near-capital items that represent economic value employed on behalf of the firm, such as the present value of operating leases, write-offs and cumulative losses, and accumulated goodwill amortization. The rationale for including losses and write-offs in continuing capital is that these represent unproductive assets, or failed investment. Were they excluded from the capital equation, the sum would only count successful efforts and not accurately reflect the performance of the firm Accumulated goodwill amortization likewise needs to be included in invested capital because it represents a true investment. Excess cash not needed for operations, such as marketable securities, may be deducted from the invested capital base. Cost of capital. The capital charge applied against NOPAT should be based on a blend of the costs of all the types of capital the firm employs, or the weighted average cost of capital WACC-k (1-1) D D+E+KENDE) . AI e hp $ 4. % 5 6 6 & 7 8 9 O SUS PEPSL 2001 /Co2013%20Pepsipdf 15/16 100% Vand up alorrig leases, write-offs and cumulative losses, and accumulated goodwill amortization. The rationale for including losses and write-offs in continuing capital is that these represent unproductive assets, or failed investment. Were they excluded from the capital equation, the sum would only count successful efforts and not accurately reflect the performance of the firm. Accumulated goodwill amortization likewise needs to be included in invested capital because it represents a true investment. Excess cash not needed for operations, such as marketable securities, may be deducted from the invested capital base Cost of capital. The capital charge applied against NOPAT should be based on a blend of the costs of all the types of capital the firm employs or the weighted average cost of capital WACC-K(1-1) D/(D+E) + K EXD+E) where T K D E Cost of debt Effective marginal tax rate Cost of equity Total debt Total equity AM 0 RI hp . 8 7 o 9 6 4 5 00 2 P O 20 T Y U 16/16 100% For the exclusive use of M. SANTA, 2021. -16- 1 UV0008 Exhibit 9 (continued) The cost of debt (used for both debt and leases) is the annual rate consistent with each firm's bond rating. The cost of equity may be estimated in a variety of ways-a usual practice is to use the capital-asset pricing model Ke-RB (R.-R) where: RI - Risk-free rate, typically the yield on 10-year US Treasury bonds B = Beta, a measure of the volatility of a company's stock price with respect to market movements Re-Ri - Market-risk premium, the additional return investors require over the risk- free rate to compensate them for investing in companies RI hp O 5 6 7 00 9 O 20 T Y U 1 O P G H K 111 100% + si Case (1).pdf Coke versus Pepsi Case study: Please note that even though it is a team exercise, and you will be tempted to divide and conquer, it is extremely important that every member fully understands all aspects. If not, you will have partial learning and may struggle in the future courses. I Conduct an in-depth financial analysis: Note, first three questions are based on data in the case. The last two questions are based on using more current data (use Mergent data base) 1 EVA Analysis: Examine the historical performances of Coca-Cola and PepsiCo in terms of EVA; formula provided in the case study (Note: NOPAT is same as EBITAT or EBIT (1-tax rate). a. You should look under the hood, who is driving the EVA to be better or worse. For example EBIT is driven by parameters like Sales, operating costs, and thus operating margins, etc 2. Using Financial ratios from the case: Examine the historical financial ratios, provide comparison and again look at the elements of the numerator and denominator of the ratios 3. Using your analysis in (1) and (2), which company would you chose? a Extremely important that you support this answer with quantitative analysis, Le.. provide financial and analytical evidence to support your conclusions A. Now look at recent financial performance of these two companies, using Mergent data site on Bay Path Wbrary and provide your analysis of which company would up pick and why Does your company selection differ between prior data from the case and more recent data? Support your conclusions e hip 1/16 100% COKE VERSUS PEPSI, 2001 Share Price Reaction to Merger Anna On December 4, 2000, PepsiCo, Inc., and the Quaker Oats Company issued a joint press release announcing their merger. The terms of the merger stated that PepsiCo would acquire Quaker Oats in a stock-for-stock deal valuing Quaker at around $14 billion Judging by the share-price reactions to the announcement, observers viewed the deal as yet another setback for Coca-Cola. By acquiring Quaker Oats, PepsiCo would gain access to Gatorade and control 83.6% of the sports drink market. PepsiCo already possessed extremely strong brands in the noncarbonated-beverages segment, such as Aquafina, Tropicana, and Lipton. Now through Gatorade, PepsiCo would consolidate its lead even further. Analysts estimated that PepsiCo would control around 33% of the U.S. noncarbonated-beverage market after the Gatorade acquisition, far ahead of Coca- Cola's 21%. A report by UBS Warburg stated: Given PEP's (PepsiCo's] #1 rank in the faster-growth segment and its improving competitive position in CSDs (carbonated soft drinks), we believe PEP could, over the long term, threaten Coca-Cola's lead in the domestic beverage category in all channels except fountain." Carolyn Keene, consumer analyst at the mutual fund firm Siegel, Parker and Lauck (SPL), wondered how this latest announcement would affect the two companies prospects for value creation Historically. Coca-Cola had trounced PepsiCo in terms of value created as hp 0 Jers/celes/Downloads/Coke%20v%20Pepsi.pdf 2001 2 16 In 2000, the Coca-Cola Company's (ticker symbol: KO) annual sales were $20.5 billion, and its market value reached $110.1 billion. The company was the largest manufacturer, distributor, and marketer of soft-drink concentrates and syrups in the world. It also marketed and distributed a variety of noncarbonated-beverage products, which included Minute Maid orange juice, Fruitopia, Dasani bottled water, and Nestea, among others. From 1993 to 1998, the Coca-Cola Company had consistently gamered the first or second spot in Fortune's annual ranking of the top wealth creators. One of the main reasons for this was the company's strategy of spinning of its bottling operations to avoid consolidation on its balance sheet. This move, implemented in 1985, contributed to a dramatic rise in returns on equity from 23% to as much as 57% over the last two decades (Exhibit) Recently, however, the company had run into difficulties. The Asian financial crisis, South America's difficulties, and Russia's devaluation of the ruble all hurt KO. But business mistakes by Doug Ivester, CEO from 1997 to 1999, aggravated the situation An example of one such mistake occurred in November 1999, when M. Douglas Ivester CEO of Coca-Cola, instituted a 7.7% price hike on syrup, a rate that was double that of the usual increases. The Coca-Cola Company's bottles were infuriated, and felt that Ivester was gouging them in order to increase KO's profits. In response, the bottles raised prices for the first time in years to improve profitability, resulting in a decrease in volume (Exhibit 3). During Ivester's approximately two-year term, net income fell by 41%. The company's board of directors eased Ivester out in December 2000 Douglas Dalt, head of Coca-Cola's Middle and Far East and Africa groups, was chosen to succeed Ivester. Upon taking over, Daft immediately instituted major organizational changes such as cutting staff and reducing burocracy. But perhaps the most important change was luis acknowledgment that KO needed to be a dominant player in the nocarbonated-beverages market. In contrast to lvester, who had insisted on pushing the company's core s-drink search 0 RI (hp * 4 5 5 6 & 7 8 9 R T T Y U 3/16 100% brands-Coca-Cola, Fanta, Sprite, and Diet Coke-Daft and his executives worked hard to come up with new, noncarbonated products. Some analysts were optimistic that the change in management would return the Coca- Cola Company to its glory days. Perhaps through improved relations with bottlers and acquisitions of noncarbonated beverages, KO would return to the pre-1998 profit margins. Other analysts were less enthusiastic One thing was certain, however, with PepsiCo's invigorated management, KO would need to get back on its feet as quickly as it could Company Background: PepsiCo, Ine. In 2000, PepsiCo, Inc., was a $20 billion company involved in the snack food, soft drink, and noncarbonated beverage businesses. The company sold and distributed salty and sweet snacks under the Frito Lay trademark and manufactured concentrates of Pepsi, Mountain Dew, and other brands to sell to franchised bottlers. The company also produced and distributed juices and other noncarbonated beverages Snack foods accounted for roughly two-thirds of PepsiCo's sales and operating income, while beverages accounted for the remainder Positioning PepsiCo as a focused snack-and-beverage company in 2000 was due mostly to the efforts of Roger Enrico, CEO from 1996 to 2000. During his tenure, Enrico instituted a massive overhaul at PepsiCo. In 1997, he sold off the fast-food chains KFC, Taco Bell and Pizza Hut, ridding PepsiCo of a business that had long been a drag on returns. In 1999, he spun off Pepsi's capital-intensive bottling operations into an independent public company. By spinning of the bottling operations, PepsiCo would be left with just the higher-margin business of selling concentrate to bottlers. At the same time, independent PepsiCo bottlers would be able to raise capital on their own, freeing up cash flow within the parent company for other uses. Enrico also took aggressive steps to make PepsiCo a total beverage company. He brokered the acquisitions of Tropicana, the market leader in orange juice, and Ouaker Oats, whose Gatorade brand dominated the energy-drink market nanum Punit man hp 2 $ 08 3 5 6 7 8 9 O E 20 T Y 1 Industry Overview and Competitive Events In 2000, the beverage industry was undergoing a rapid transformation: the noncarbonated drinks segment, although still representing only a small fraction of the beverage market, had grown by 62% in volume over the last five years, while soft-drink-volume growth had been sluggish. According to Beverage Digest, the share of the carbonated soft drink industry fell from 71.3% in 1990 to 60.5% in 2000 In soft drink volume, PepsiCo still laggod behind Coke, although it seemed to have caught up somewhat in recent years (Exhibit 3). In the fall of 1999, for instance, PepsiCo, for the first time in its history, Occupied two of the top three places for US soft-drink brands on store shelves as its Mountain Dew dislodged Diet Coke from third place Recent developments at both companies signaled an aggressive new round of competition. Below is a summary of recent competitive moves by both companies in several beverage categories Soft drinks Over the last five years, Pepsi had launched aggressive and exciting marketing campaigns (eg, "Generation Next. "Joy of Pepsi) that helped boost volume and visibility. In addition, Pepsi launched the "Power of One" campaign-a strategy that entailed moving Pepsi drinks next to Frito Lay chips on store shelves to entice shoppers to pick up a Pepsi when they bought chips. This strategy also helped boost both Frito-Lay and Pepsi's volumes. In response to the success of the Pepsi campaigns, in the summer of 2000, Coca-Cola tesorted to a number of tactics, such as veering away from its traditional feel good ads and launching trendier ones. Unfortunately, the new ads were highly unpopular and clicited negative reactions from customers and bottlers! Coca-Cola pulled the ads and replaced them with the Life Tastes Good" series, which marked a return to Coke's traditional "feel-good" themes, while being trendy at the same time Noncarbonated beverages ca E e hp 4 5 6 N 00 9 O E R. T Y U o P 72 F G H K L Company Background: PepsiCo, Inc. In 2000, PepsiCo, Inc., was a $20 billion company involved in the snack food, soft drink, and noncarbonated beverage businesses. The company sold and distributed salty and sweet snacks under the Prito-Lay trademark and manufactured concentrates of Pepsi, Mountain Dew, and other brands to sell to franchised bottlers. The company also produced and distributed juices and other noncarbonated beverages. Snack foods accounted for roughly two-thirds of PepsiCo's sales and operating income, while beverages accounted for the remainder Positioning PepsiCo as a focused snack-and-beverage company in 2000 was due mostly to the efforts of Roger Enrico, CEO from 1996 to 2000. During his tenure, Enrico instituted a massive overhaul at PepsiCo, In 1997, he sold off the fast-food chains KFC, Taco Bell, and Pizza Hut, ridding PepsiCo of a business that had long been a drag on returns. In 1999, he spun off Pepsi's capital-intensive bottling operations into an independent public company. By spinning off the bottling operations, PepsiCo would be left with just the higher-margin business of selling concentrate to bottlers. At the same time, independent PepsiCo bottlers would be able to raise capital on their own, freeing up cash flow within the parent company for other uses. Enrico also took aggressive steps to make PepsiCo a "total beverage company. He brokered the acquisitions of Tropicana, the market leader in orange juice, and Quaker Oats, whose Gatorade brand dominated the energy-drink market. During Enrico's term, PepsiCo's return on equity almost doubled, from 17% in 1996 to 30% in 2000. (See Exhibit 2 for historical returns and Exhibit I for a historical EVA analysis.) On Wall Street, analysts were upbeat about PepsiCo's prospects 0 . g hp $ 4 5 6 & 7 8 9 O 100% brands-Coca-Cola, Fanta, Sprite, and Diet Coko-Daft and his executives worked hard to come up with new, noncarbonated products Some analysts were optimistic that the change in management would return the Coca- Cola Company to its glory days. Perhaps through improved relations with bottlers and acquisitions of noncarbonated beverages, KO would return to the pre-1998 profit margins. Other analysts were less enthusiastic. One thing was certain, however, with PepsiCo's invigorated management, KO would need to get back on its feet as quickly as it could Company Background: PepsiCo, Inc. In 2000, PepsiCo, Inc., was a $20 billion company involved in the snack food, soft drink, and noncarbonated beverage businesses. The company sold and distributed salty and sweet snacks under the Frito-Lay trademark and manufactured concentrates of Pepsi, Mountain Dew and other brands to sell to franchised bottlers. The company also produced and distributed juices and other noncarbonated beverages * Snack foods accounted for roughly two-thirds of PepsiCo's sales and operating income, while beverages accounted for the remainder Positioning PepsiCo as a focused snack-and-beverage company in 2000 was due mostly to the efforts of Roger Enrico, CEO from 1996 to 2000. During his tenure, Enrico instituted a massive overhaul at PepsiCo In 1997, he sold off the fast-food chains KFC, Taco Bell, and Piana Hut, ridding PepsiCo of a business that had long been a drag on returns. In 1999, he spun off Pepsi's capital-intensive bottling operations into an independent public company. By spinning of the bottling operations, PepsiCo would be left with just the higher-margin business of selling concentrate to bottlers. At the same time, independent PepsiCo bottlers would be able to raise capital on their own, freeing up cash flow within the parent company for other uses. Enrico also took aggressive steps to make PopsiCo a total beverage company. He brokered the acquisitions of Tropicana, the market leader in orange juice, and Quaker Oats, whose Gatorade brand dominated the energy drink market latian min f hop + & $ 3 5 6 7 8 9 9 E R. T Y U 1 O P. 3 COKE VERSUS PEPSI, 2001 Downloads/Coke%20v%20Pepsi pdf 100% Noncarbonated beverages Coke and PepsiCo raced to position themselves in this important and fast growing market segment Orange juiceIn 1998, PepsiCo acquired Tropicana, the clear market leader in orange juice. Tropicana held more than 40% of the total chilled orange juice market and 70% of the not * McCarthy, Hufferte Coke's Mostle over Ouker "Ficom, November 25, 2000 John A lyopiCo's New Formula Hlow Roger Enrico is Remaking the Company Murid April 10, 2000 * The ads were prodoved the Cut Freeman Ad Agency, famous for its controversial do com a in which perbils were shown being shot out of a camion One Cole commercial featured a grandmother in a wheelchair to throws um when the discovers there is no Cokie stately reunion For the exclusive use of M. SANTA, 2021. UVOOR from-concentrate orange juice segment in the United States Coke's Minute Maid had less than 20% of the chilled orange juice market Baddress which hp : 4 96 5 6 7 00 9 0 R. T Y U 1 o P 3 TH G H K COKE VERSUS PEPSI, 2001 Bes/Downloads/Coke. 20Pepsi.pdf 1009 Bottled water. PepsiCo test marketed Aquafina as early as 1994, while Coke, with its Dasani brand, did not enter the bottled water market until 1999. Aquafina was the number one ranked bottled water brand in the US market in 2000 Iced tea: PepsiCo's Lipton boasted a 16-point share load over Coca-Cola's Nesten Sports drinks Pending the Federal Trade Commission's approval of the PepsiCo Quaker Oats deal, PepsiCo would own Gatorade, which held 83% of the US sports-drink market. Coca- Cola's Powerade was a distant second at 11% Specialty drink PepsiCo, in alliance with Starbucks, introduced the highly popular Starbucks Frappuccino in 1996. It took Coca Cola until 2000 to announce that it was going to test market a frozen coffee beverage. In October 2000, PepsiCo beat Coca-Cola in acquiring South Beach Beverage Company, maker of the Soe brand of teas and fruit juices Financial Comparison Analysts expected that the coming months would be among the most exciting in the Coke Pepsi saa. It would be interesting to see how the revived cola wars" would play out in the meantime, a look at some performance measures might provide clues as to what the future held Ratio analyse Exhibits and present a variety of analytical ratios computed from the financial statements of each firm Economic profil analysis. Also known as economic value-added, EVA can be used to estimate the value created or destroyed by comparing a firm's cash operating profits ar net operating profits after tax (NOPATI ainst a capital charge IVANOPAT (Weighted average cost of capital invested capital) Alternatively, the formula could be written as EVA - Return on invested capital - WACC) Invested enital (hp 14 $ 56 5 6 & 7 00 9 R. T T Y U 1 o P 1 Industry Overview and Competitive Events In 2000, the beverage industry was undergoing a rapid transformation: the noncarbonated drinks segment, although still representing only a small fraction of the beverage market, had grown by 62% in volume over the last five years, while soft-drink-volume growth had been sluggish. According to Beverage Digest, the share of the carbonated soft drink industry fell from 71.3% in 1990 to 60.5% in 2000 In soft drink volume, PepsiCo still laggod behind Coke, although it seemed to have caught up somewhat in recent years (Exhibit 3). In the fall of 1999, for instance, PepsiCo, for the first time in its history, Occupied two of the top three places for US soft-drink brands on store shelves as its Mountain Dew dislodged Diet Coke from third place Recent developments at both companies signaled an aggressive new round of competition. Below is a summary of recent competitive moves by both companies in several beverage categories Soft drinks Over the last five years, Pepsi had launched aggressive and exciting marketing campaigns (eg, "Generation Next. "Joy of Pepsi) that helped boost volume and visibility. In addition, Pepsi launched the "Power of One" campaign-a strategy that entailed moving Pepsi drinks next to Frito Lay chips on store shelves to entice shoppers to pick up a Pepsi when they bought chips. This strategy also helped boost both Frito-Lay and Pepsi's volumes. In response to the success of the Pepsi campaigns, in the summer of 2000, Coca-Cola tesorted to a number of tactics, such as veering away from its traditional feel good ads and launching trendier ones. Unfortunately, the new ads were highly unpopular and clicited negative reactions from customers and bottlers! Coca-Cola pulled the ads and replaced them with the Life Tastes Good" series, which marked a return to Coke's traditional "feel-good" themes, while being trendy at the same time Noncarbonated beverages ca E e hp 4 5 6 N 00 9 O E R. T Y U o P 72 F G H K L COKE VERSUS PEPSI, 2001 Bes/Downloads/Coke. 20Pepsi.pdf 1009 Bottled water. PepsiCo test marketed Aquafina as early as 1994, while Coke, with its Dasani brand, did not enter the bottled water market until 1999. Aquafina was the number one ranked bottled water brand in the US market in 2000 Iced tea: PepsiCo's Lipton boasted a 16-point share load over Coca-Cola's Nesten Sports drinks Pending the Federal Trade Commission's approval of the PepsiCo Quaker Oats deal, PepsiCo would own Gatorade, which held 83% of the US sports-drink market. Coca- Cola's Powerade was a distant second at 11% Specialty drink PepsiCo, in alliance with Starbucks, introduced the highly popular Starbucks Frappuccino in 1996. It took Coca Cola until 2000 to announce that it was going to test market a frozen coffee beverage. In October 2000, PepsiCo beat Coca-Cola in acquiring South Beach Beverage Company, maker of the Soe brand of teas and fruit juices Financial Comparison Analysts expected that the coming months would be among the most exciting in the Coke Pepsi saa. It would be interesting to see how the revived cola wars" would play out in the meantime, a look at some performance measures might provide clues as to what the future held Ratio analyse Exhibits and present a variety of analytical ratios computed from the financial statements of each firm Economic profil analysis. Also known as economic value-added, EVA can be used to estimate the value created or destroyed by comparing a firm's cash operating profits ar net operating profits after tax (NOPATI ainst a capital charge IVANOPAT (Weighted average cost of capital invested capital) Alternatively, the formula could be written as EVA - Return on invested capital - WACC) Invested enital (hp 14 $ 56 5 6 & 7 00 9 R. T T Y U 1 o P 1 > CON VERSUS PEPSL 2001 cele Downloads 100N Financial Comparison Analysts expected that the coming months would be among the most exciting in the Coke Pepsi saga It would be interesting to see how the revived "cola wars" would play out in the meantime, a look at some performance measures might provide che as to what the future held Rational Exhibits 4 and 5 present a variety of analytical ratios computed from the financial statements of each firm. Economic profirana Also known as economic value-added, EVA can be used to estimate the value created or destroyed by comparing a firm's cash operating profits or net operating profits after tax (NOPAT) against a capital charge EVA - NOPAT (Weighted average cost of capital invested capital) Alternatively, the formula could be written as EVA - (Return on invested capital WACC)Invested capital Return on invested capital (ROC), as the name suggests could be calculated by dividing NOPAT by invested capital. The second formula highlights the idea that aproad" cared beyond a company's cost of capital results in value creation "WACC 2:15 422/2 hp + $ 4 3 5 6 & 7 C 9 8 o E R T Y U o P t > COKE VERSUS PE 2001 /DownloadCowoops 1001 For the exclusive use of M. SANTA, 2021. UVON Conclusion Coke and Pepsi had created one of the strongest rivalries in the story. Carolyn Keene now wanted to develop a view what the two companies are performances. She obtained pro forma projections for the two fimm from reports prepared by analyst Credit Suisse First Weston (Exhibits 6 and 7), and gathered information about our capital market conditions Exhibit). She also took out her gosdelines for estimating the components EVA Exhibit li would be nice to finish her analysis before going off for Christmas hak 9:35 AM A: E e hp 5 4 90 5 6 & 7 00 9 o R T COKE VERSUS PEPSL 2001 /Downloads/Coke%20v%20Peps.pdf 12 / 16 100% CORE VERSUS METSZOT Income-Statement and Balance Sheet Forecasts for Coca-Cola Halone 22.50 Cheval 5285 6612 MN 2013 20334 CES Ne posting Cost of goods Crows pola 2,06 1.910 2.419 304 14131 15. 16 103 1. 7.50 7.5 1959 Gold 124 1211 333 18 2.4 Torrent in bon Marbeit ME Le depreciation NAI Keluh T 592 2.4 7.334 (2013 Uw 21 6.40 2. H TI 4 . 244 295 OM 107 254 CH 261 4 141 AN con qy heim Pino 6.14 3. 300 154 APA be Comme Acom Tesis 3.500 151 734 1.400 7 2013 . 44 MI 136 WI app format he den T 107 167 30 191 295 10 TH 2010 70 Lud HO 2 . 23 000 115 367 for accumulated throw 100 Hd Video, www Des de CSI 2001 DI hp 40 S 4 5 6 & 7 8 9 T P 11 / 16 100% Exhibit 5 COKE VERSUS PEPSI, 2001 Analytical Financial Ratios for PepsiCo, Inc 7661 1995 19 1997 361 1999 2000 Activity Anahi Avere days olding Working capital turnover Find somover Total cover 2533 (14.07 164 26.89 513.67 1.72 1.30 22.19 2008 182 127 40.71 20.98 1.42 37.59 (2869) 1.57 IOS 3725 (12.56) 155 3128 38.78 205 114 10 1 90 Liquidity Analysis Carreto Cahatin Cash from operation to 106 0.29 0.72 100 0.15 0.62 1.47 0.69 OSO 0:55 0.05 041 1.10 0.28 O.NO 1.17 0.34 0.99 0.71 0.71 557 Long Term Debt and solvency Analysis Deity Time interest Gamed Freddare aveti Capital expenditure Cash from periode 1.39 445 103 165 0.39 1.73 43 2.72 1.78 0.10 197 434 248 1.33 012 1.24 654 3.00 2.39 0.00 0.44 7.75 3.73 2.71 0.99 0:35 14.59 436 167 160 327 0.69 NO Profitability Analysis Openingar Napoli HOA RON Taillefest IN 6:29 711 2411 54% * SVE M 127) 10. N 16.95 451 11.69 29 2.1 33 10194 10,29 15. 10.94 122 290 32.14 NIN WTS 230 53 300 054 77.11 Growth Sales 11 SU 3 UNE 63 127 -22 0.14 454 6.11 Ne mobilis NOPAT 2016 -In -7 - 121 10.15 2 -14 -2.5 14 409 SP -70% 2.1 2.11 On 119 144 ONUN. hp $ 4 5 9 & 7 8 9 Exhibit 4 COKE VERSUS PEPSI, 2001 Analytical Financial Ratios for the Coca-Cola Company 1995 1997 1998 6661 2000 Activity Analysis Avere days outstanding Working capital turnover Fixed acts over Total se tumover 3124 (1633) 3.50 1.08 31.71 (6.52) 32.61 (11.17) 3.60 1.12 32.83 (1062) 3.87 1.15 31.73 (890) 4.13 112 32.06 (6.14) 436 31.92 (5.49) 1.79 105 091 0.59 080 075 Liquidity Analysis Current ratio Cash ratio Cash from operations to 0.64 0.25 0:54 0.16 0.21 0.87 0.18 0.35 0.90 0.18 0.39 0.87 0.30 0.38 0.47 0:47 Long Term Debt und Solvency Analysis Det er to Times interest comed frudharyotage Capital expendituremat Cash from operations de train 067 18.63 10.03 0.61 19 18 0.75 140 9.87 3.55 02 0.73 130 7.13 350 0.77 8.99 0.65 17.93 8.70 198 055 0.65 1182 60 3.63 0.62 8.36 5.77 4.89 0.63 RT 69 0.6 0.78 Profitability Analysis Operating margin Net profit may ROA RE 154 16. 23:35 I. 1774 2119 IN 1919 51.7 265% 21.99 2119 40 2641 188 229% 46.19 2. 20.1% 123 17.34 37.1% TRON 1067 IN 25. 61 MET 10.15 TI 15.99 15. 167 2. 149 179 45 12 34 1349 -14 31 129 . 16.9% Growth S Book Net noe hele ANOPAT Netice Opng . -16 -1046 100 16 16. -1444 114 1955 IR 277 -1939 - -1 NEC p hp 49 4 96 5 6. & 7 8 9 2 Downloads/Cok s%20Pepsi.pdf 13/16 100 COKE VERSUS PEPSI, 2001 Income-Statement and Balance Sheet Forecasts for PepsiCo Peplice MESSA IK 2016 11.307 Rev Beverages Fry Der Tode 2003 13.116 1607 10343 14 041 27.00 444 1,141 1ATT 44 4141 7,497 186 2,73 100 379 MU 2 3415 1,164 Opto Bever AK, help Other Tech 2 Ses 1.49 1.000 IMN UI 2015 4,42 1.469 2679 40 11 JAPAI Data Swag Corpo LAN 40 010 455 M 4.18 7400 4.56 2.995 90 CHE aff 4 1,414 3. 25714 BIT 92 IM 197 31 239 NI 499 S.STI Com | als Tel. 30 SAT 13 210 Net 2013 316 1803 4.41 4x10 Jo Tui 14. HI 950 Ir Am 23 1.140 1341 ch 1. 1.100 M 23.30 VI1,034 2014 TES Thermal 21 Soute den for depreciation wind.com odwill amount "A Balanced Formula for Growth by Andrew Coway, Chris O'Donnell, and Corey Honch Credit Sunne Fint Hoston quity Research, November 82001 it hp 5 6 7 CO 9 O %20v-%20Pepsi.pd! 100% -14- UV0008 Exhibit 8 COKE VERSUS PEPSI, 2001 Capital-Market Information on December 4, 2000 Call Shoes SA Juary 1991 December 4, 2000 sen 5.79 3.5 3 25 2 15 1 05 0 The Case Company Poplar Lates 113 2008 Chi MES AL AD 199 1903 19 IT OV 21 $ hip 20%20Pepsi.pdf 15 / 16 100% Exhibit 9 COKE VERSUS PEPSI, 2001 Some Guidelines for Estimating Components of EVA NOPAT. Net operating profit after taxes (NOPAT) is calculated with the aim of arriving at the actual cash generated by the concern. Adjustments might include adding back goodwill amortization and other noncash expenses. Taxes must similarly be adjusted to reflect only actual cash taxes. Depreciation is not added back to NOPAT despite being a noncash expense, because of the assumption that depreciation represents a true economic cost (.e., it is the amount that must be reinvested to maintain operations at the existing level). For consisteney, invested capital is measured net of depreciation lavested capital. Invested capital means, simply, the amount of capital invested in the business. It may be calculated either from the asset side or from the liabilities + equity side of the balance sheet. The latter is the simpler method. Invested capital includes debt, equity, and other near-capital items that represent economic value employed on behalf of the firm, such as the present value of operating leases, write-offs and cumulative losses, and accumulated goodwill amortization. The rationale for including losses and write-offs in continuing capital is that these represent unproductive assets, or failed investment. Were they excluded from the capital equation, the sum would only count successful efforts and not accurately reflect the performance of the firm Accumulated goodwill amortization likewise needs to be included in invested capital because it represents a true investment. Excess cash not needed for operations, such as marketable securities, may be deducted from the invested capital base. Cost of capital. The capital charge applied against NOPAT should be based on a blend of the costs of all the types of capital the firm employs, or the weighted average cost of capital WACC-k (1-1) D D+E+KENDE) . AI e hp $ 4. % 5 6 6 & 7 8 9 O SUS PEPSL 2001 /Co2013%20Pepsipdf 15/16 100% Vand up alorrig leases, write-offs and cumulative losses, and accumulated goodwill amortization. The rationale for including losses and write-offs in continuing capital is that these represent unproductive assets, or failed investment. Were they excluded from the capital equation, the sum would only count successful efforts and not accurately reflect the performance of the firm. Accumulated goodwill amortization likewise needs to be included in invested capital because it represents a true investment. Excess cash not needed for operations, such as marketable securities, may be deducted from the invested capital base Cost of capital. The capital charge applied against NOPAT should b