

Question
11.1 Excel Activity 2a - Confidence Intervals for Variance and Standard Deviation (Structured) See attached for data The table showing the stock price changes for
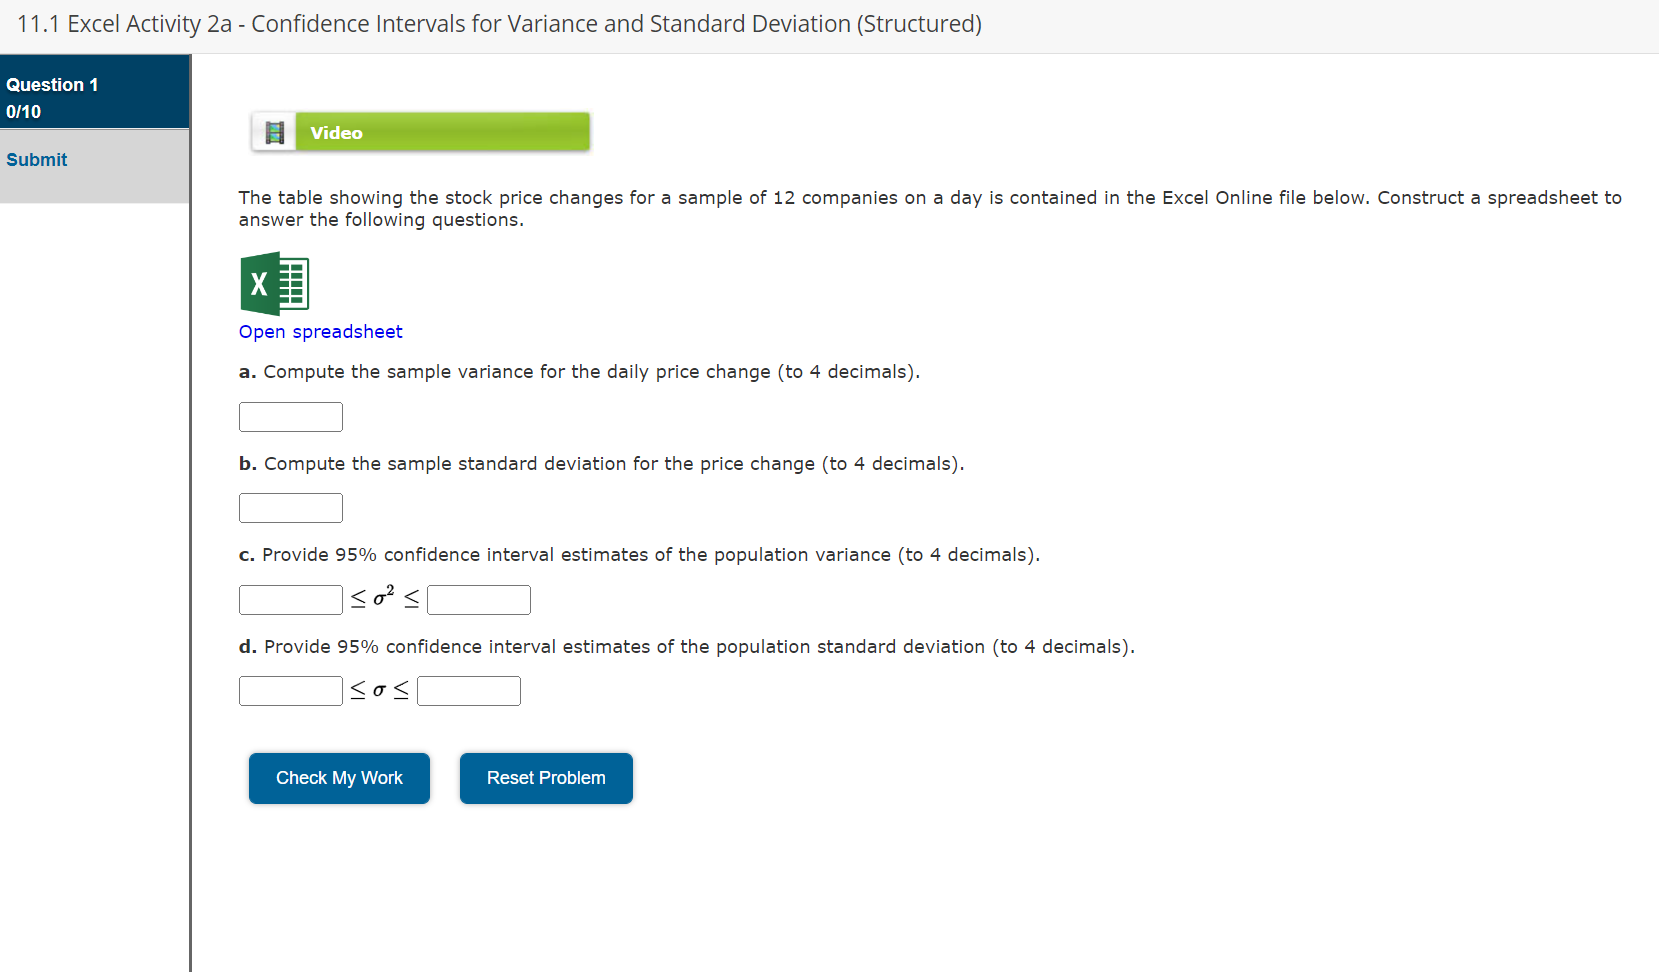

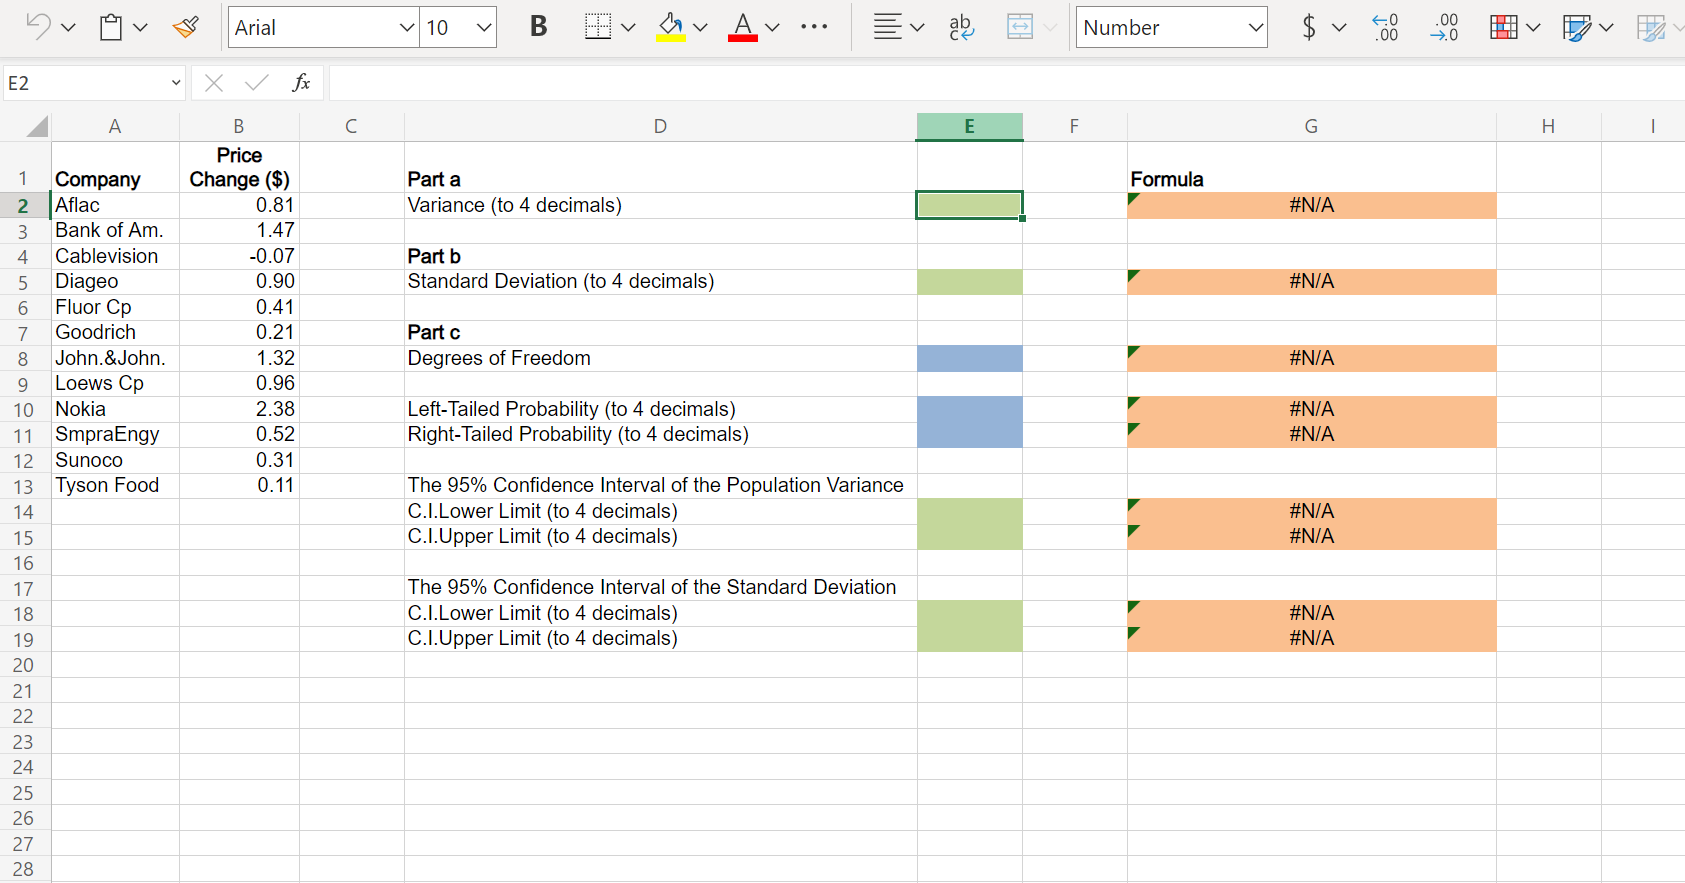
11.1 Excel Activity 2a - Confidence Intervals for Variance and Standard Deviation (Structured)
See attached for data
The table showing the stock price changes for a sample of 12 companies on a day is contained in the Excel Online file below. Construct a spreadsheet to answer the following questions.

Step by Step Solution
There are 3 Steps involved in it
Step: 1

Get Instant Access to Expert-Tailored Solutions
See step-by-step solutions with expert insights and AI powered tools for academic success
Step: 2

Step: 3
Ace Your Homework with AI
Get the answers you need in no time with our AI-driven, step-by-step assistance
Get Started
Encyclopaedia Of General Topology
Authors: Md Mushtaque Khan
1st Edition
9353147530, 9789353147532