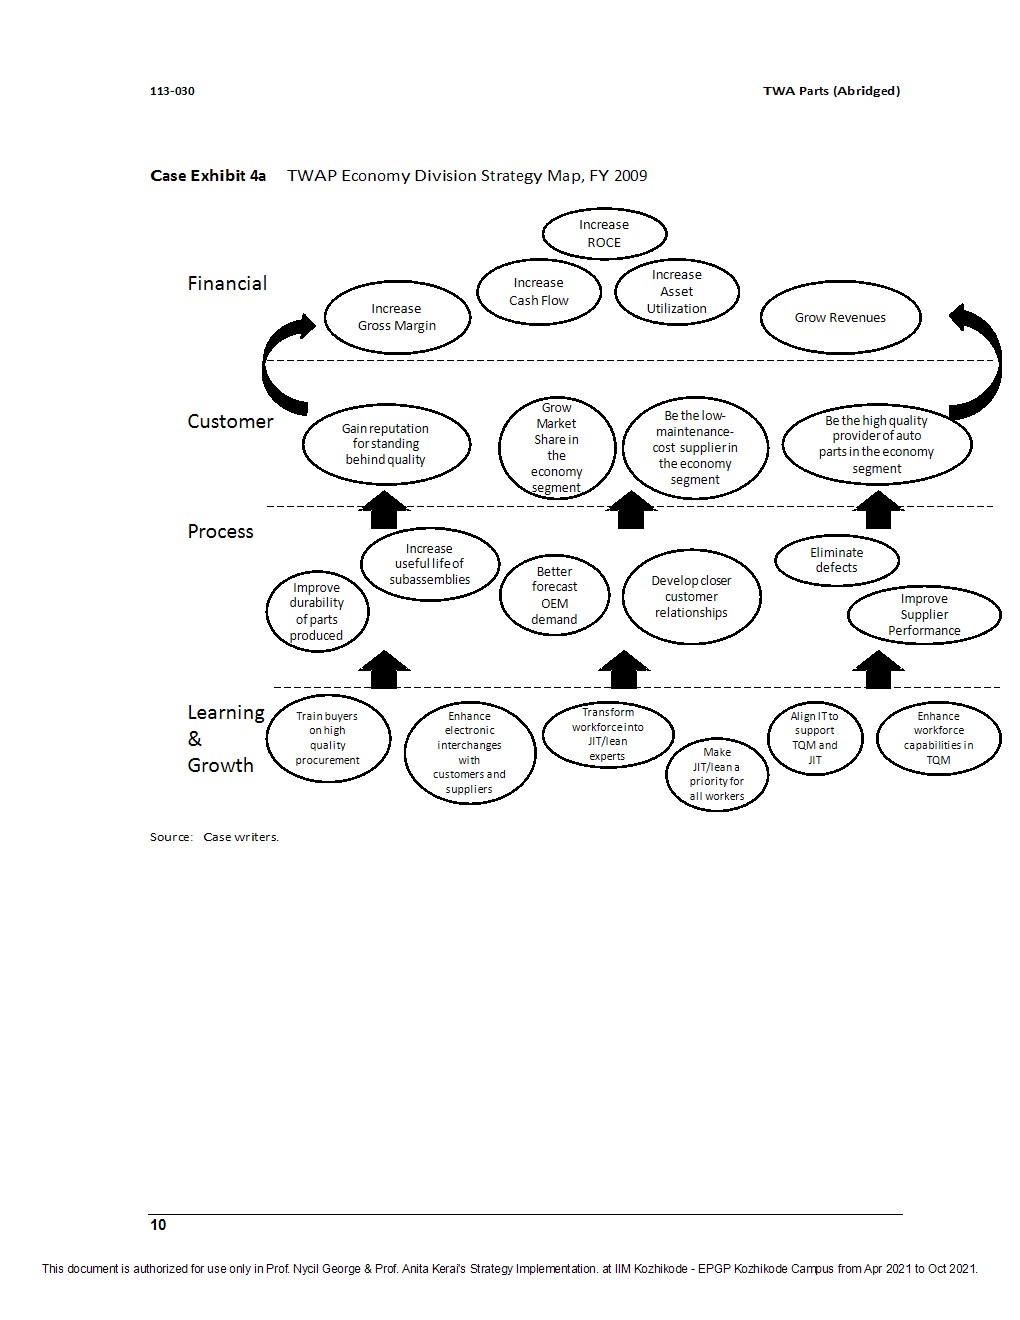
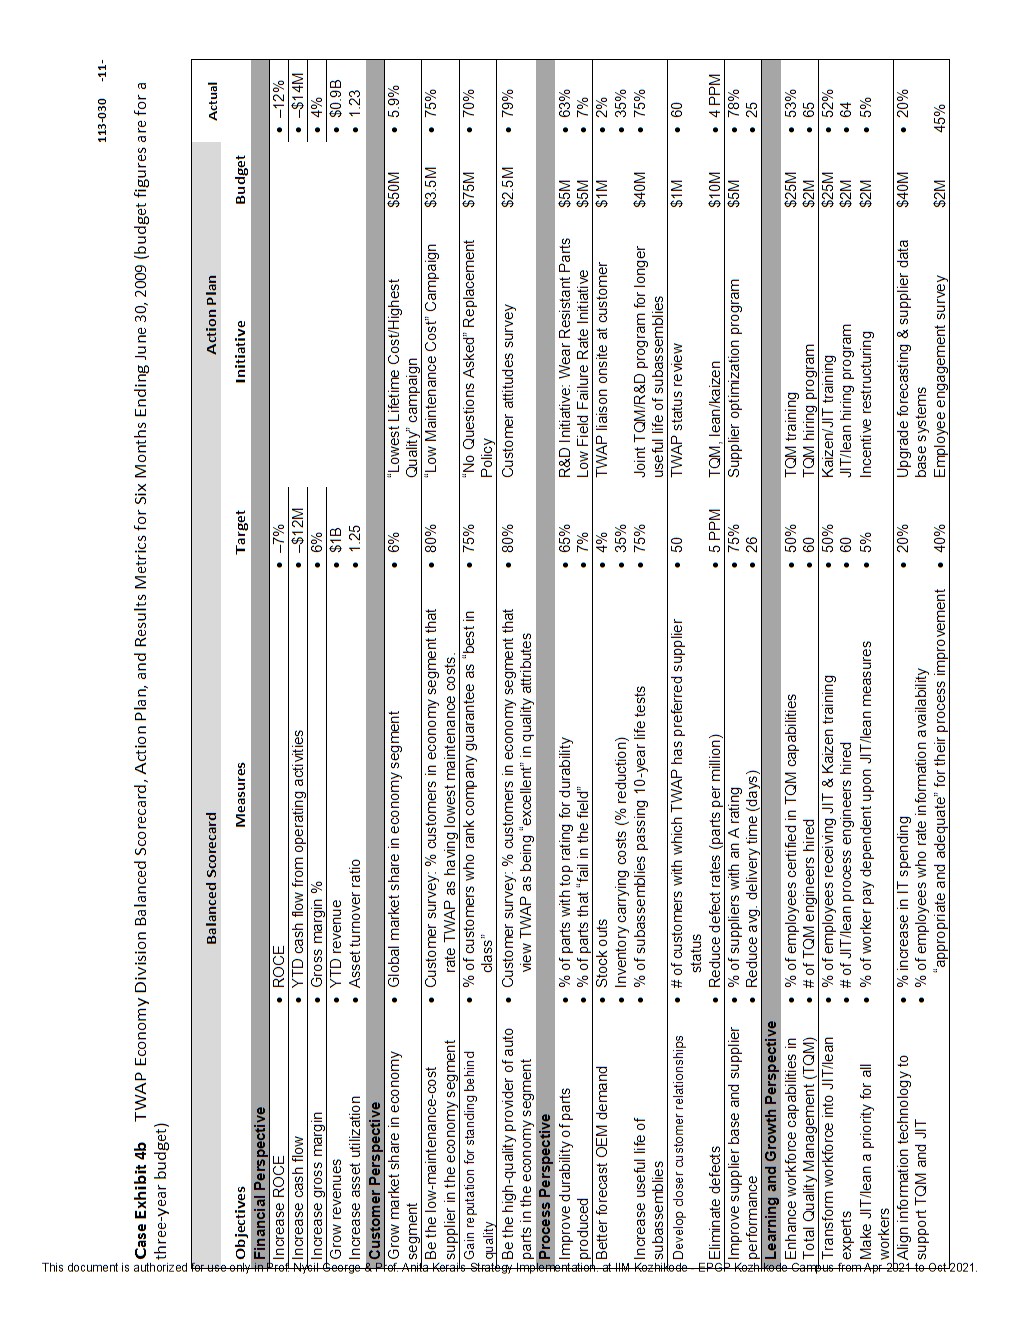
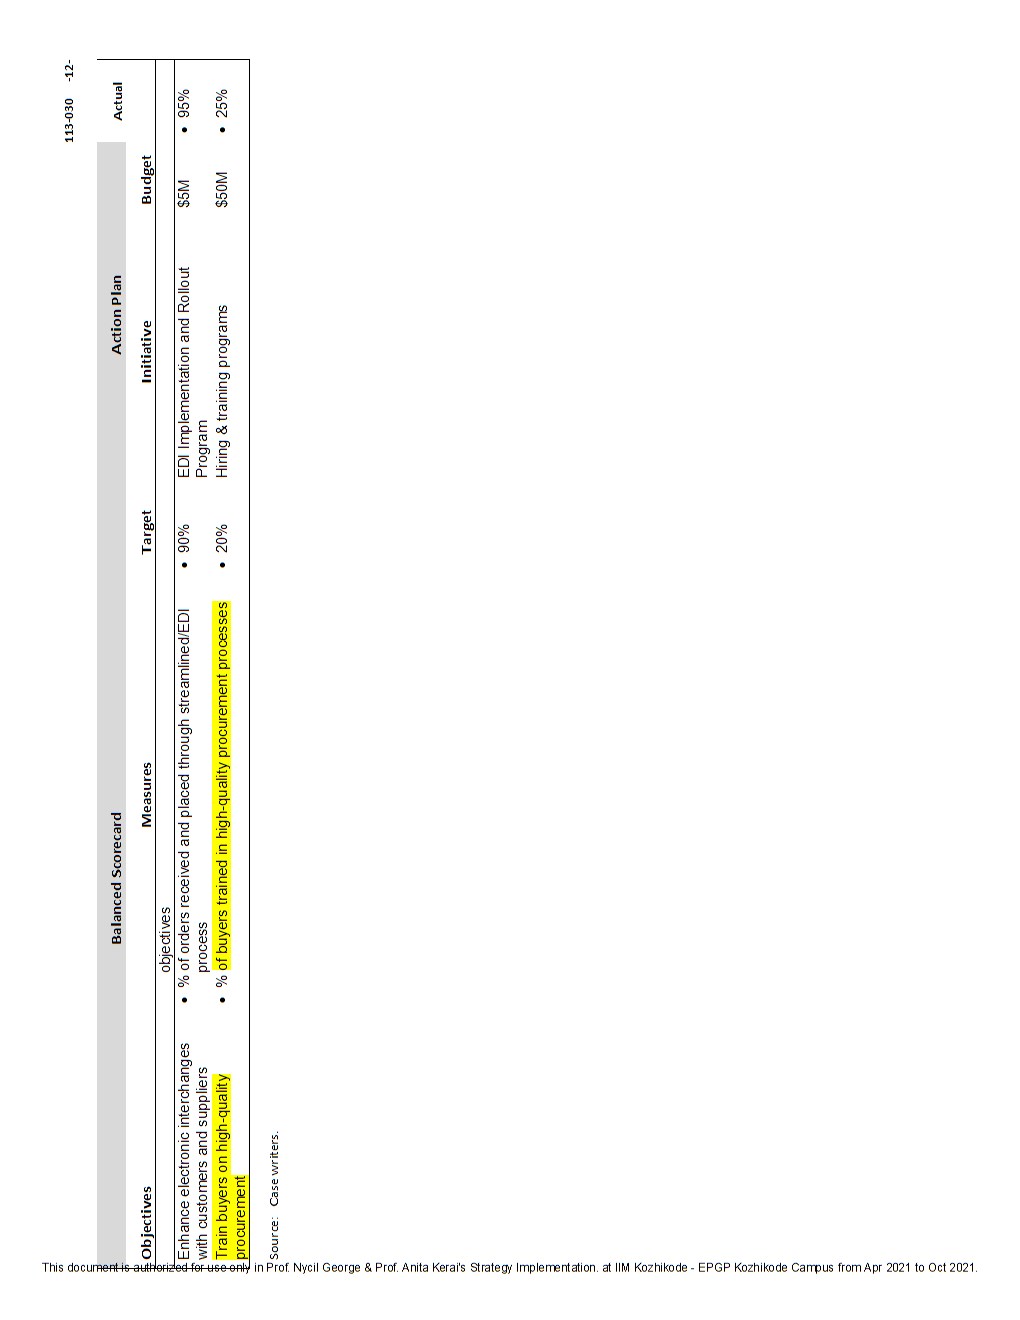
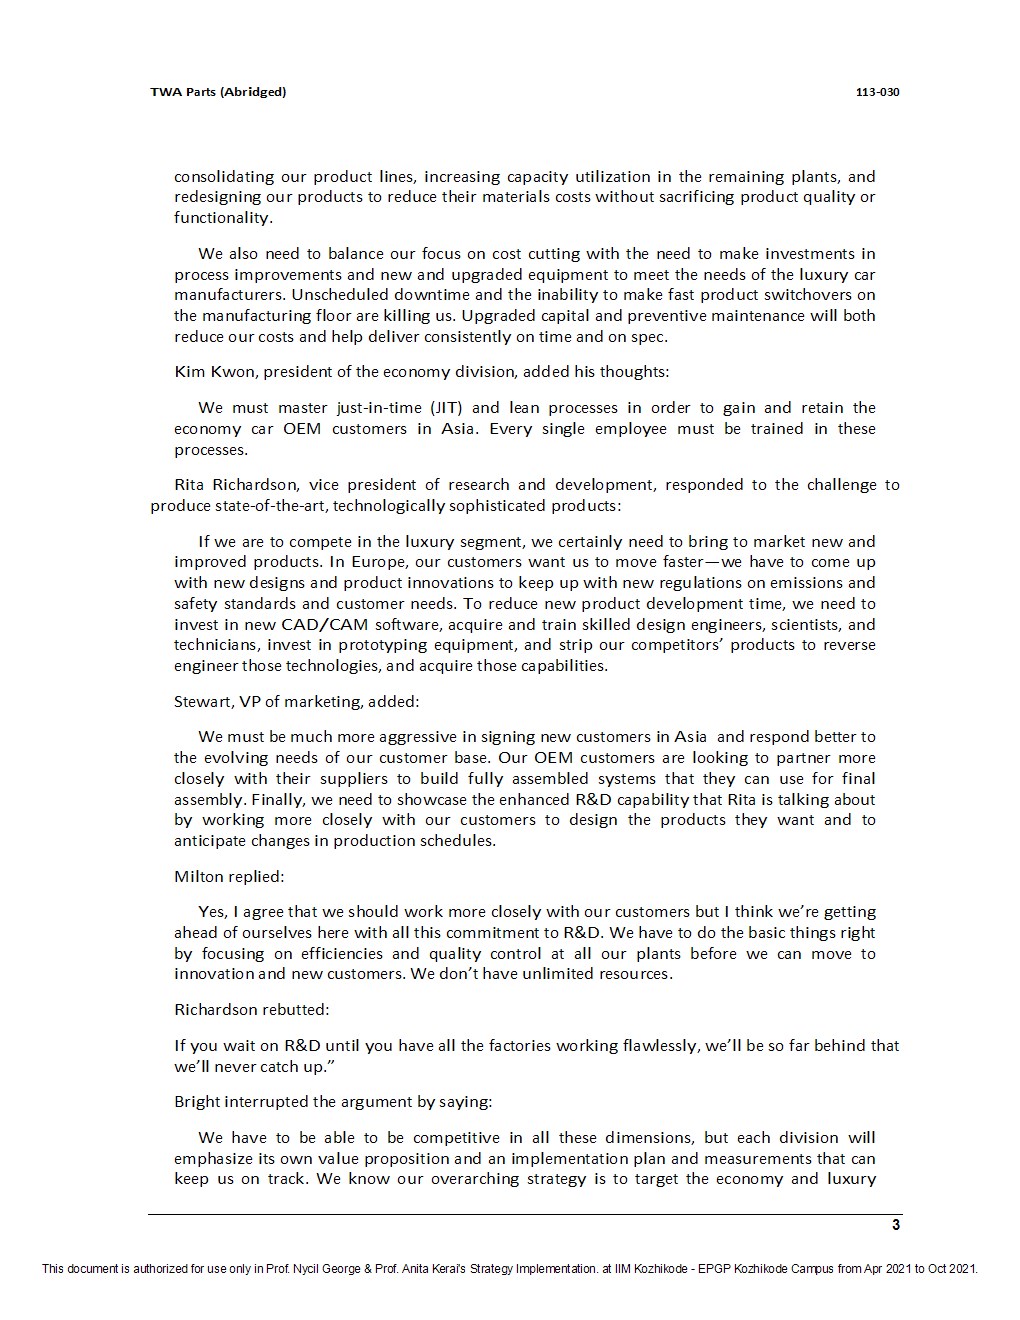
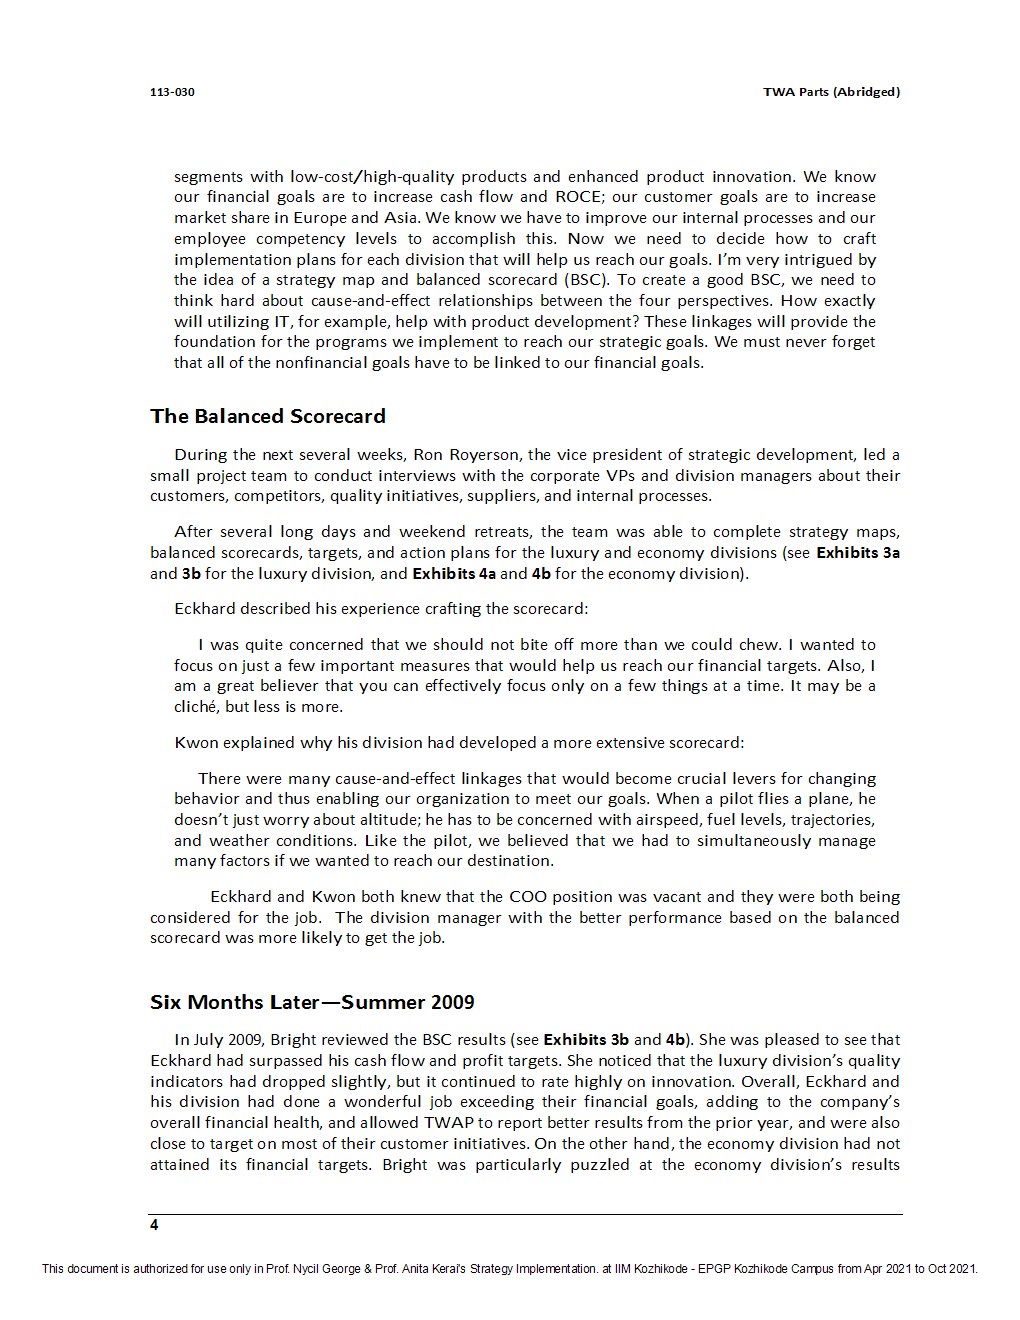
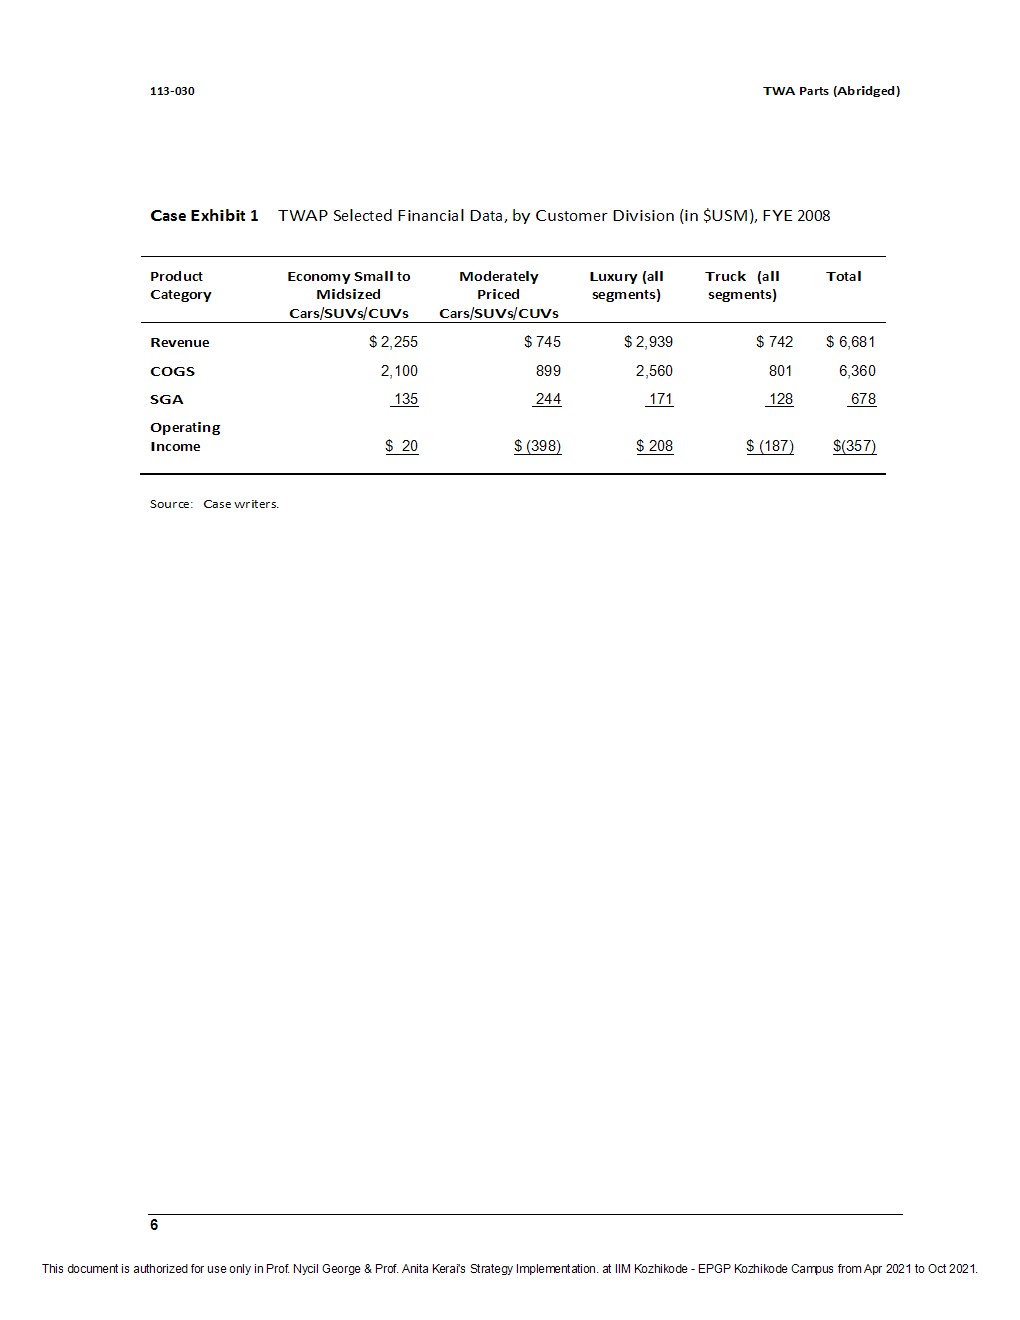
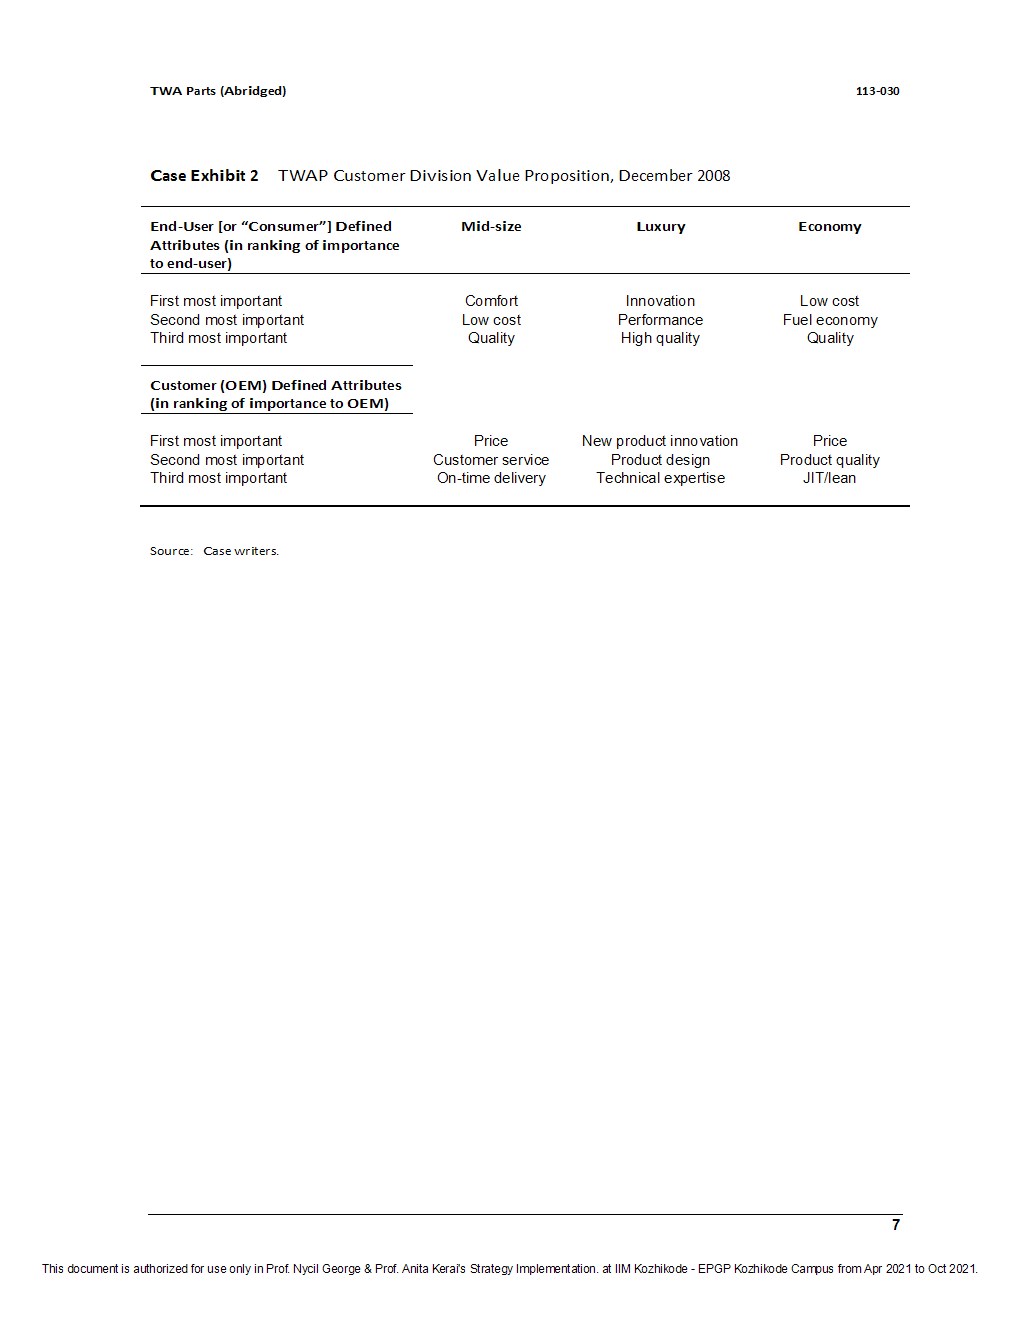
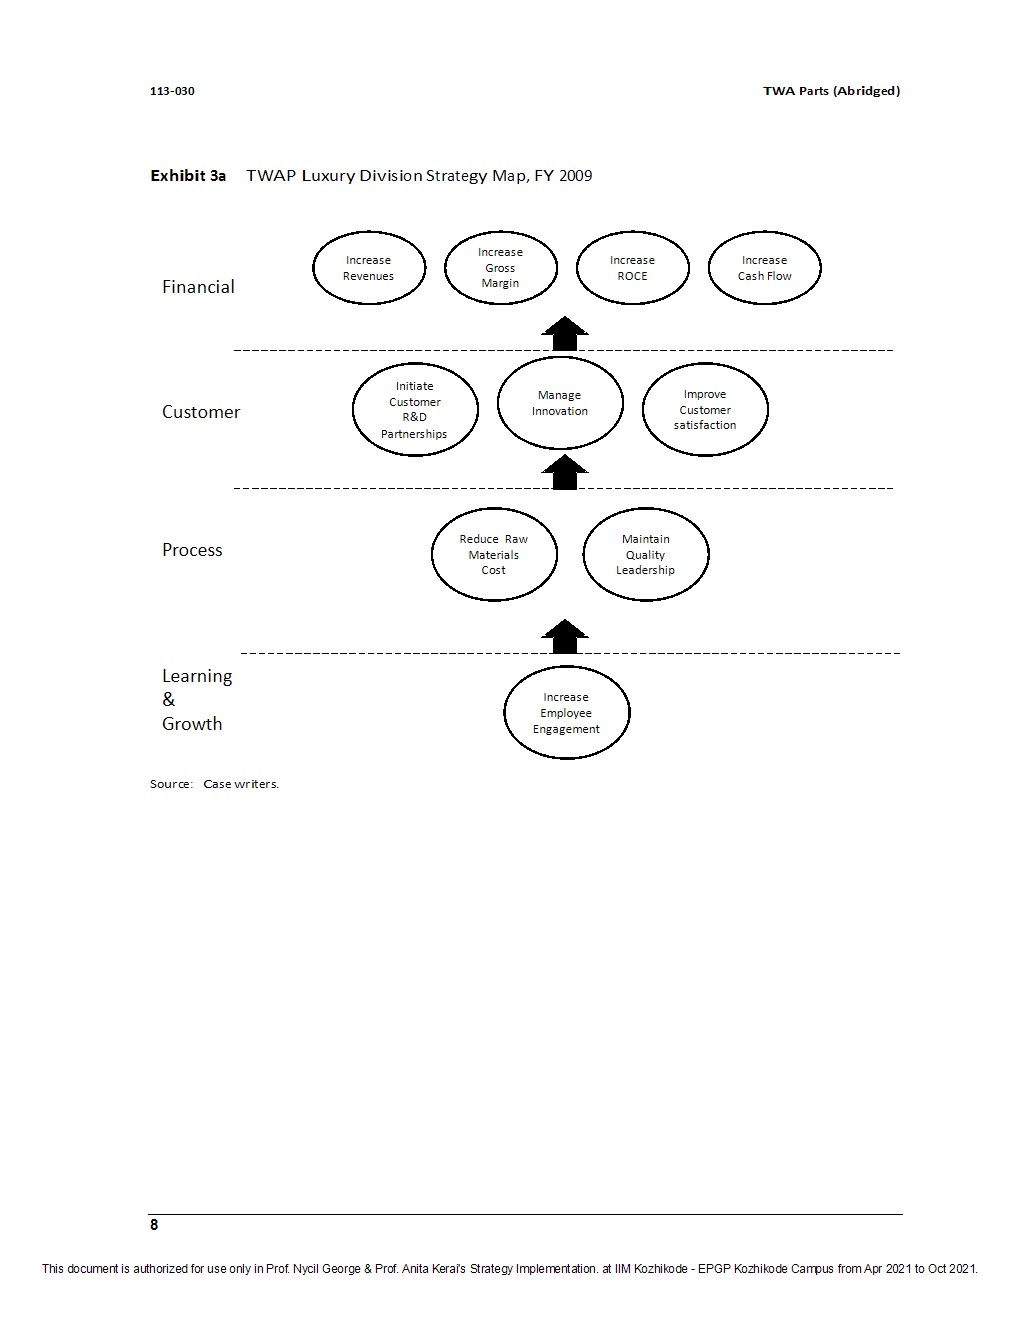
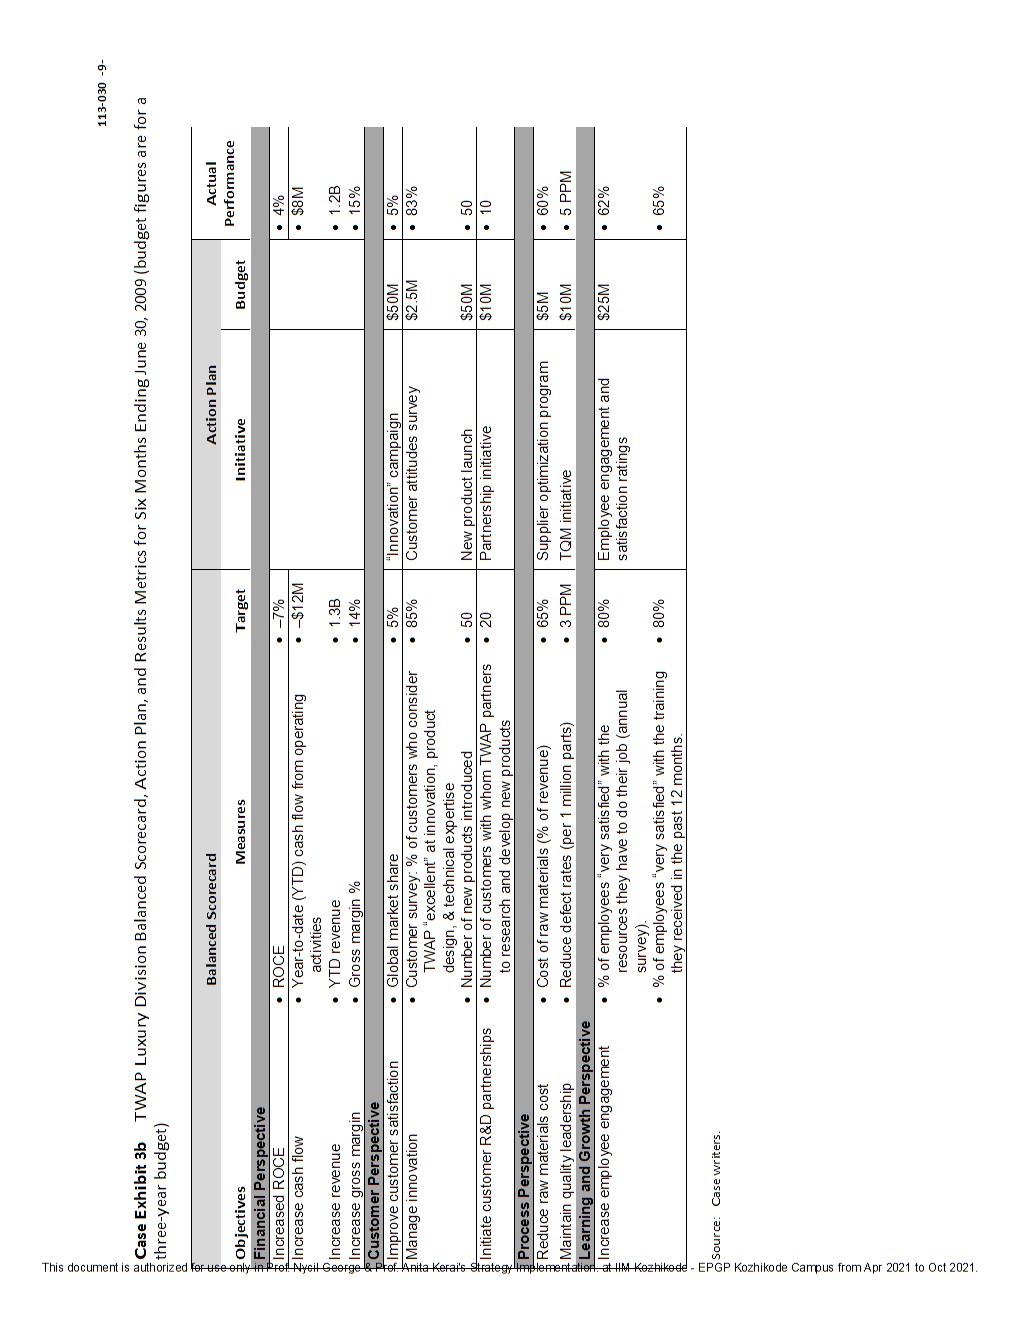
113-030 TWA Parts (Abridged) Case Exhibit 4a TWAP Economy Division Strategy Map, FY 2009 Increase ROCE Financial Increase Increase Asset Increase Cash Flow Utilization Gross Margin Grow Revenues Grow Customer Gain reputation Market Be the low- Be the high quality Share in maintenance- for standing provider of auto cost supplier in behind quality the parts in the economy economy the economy segment segment segment Process Increase Eliminate useful life of Better defects Improve subassemblies orecast Develop closer durability OEM customer Improve of parts demand relationships Supplier produced Performance Learning Train buyers Enhance Transform Align IT to Enhance 8 on high electronic workforceinto support workforce quality interchanges JIT/lear Make TOM and capabilities in Growth procurement with experts JIT TOM ustomers and JIT/leana suppliers priority for all workers Source: Case writers. 10 This document is authorized for use only in Prof. Nycil George & Prof. Anita Kerai's Strategy Implementation. at IIM Kozhikode - EPGP Kozhikode Campus from Apr 2021 to Oct 2021.113-030 -11- Case Exhibit 4b TWAP Economy Division Balanced Scorecard, Action Plan, and Results Metrics for Six Months Ending June 30, 2009 (budget figures are for a three-year budget) This document is authorized for use only in red Nyend Balanced Scorecard Action Plan Actual Objectives Measures Target Initiative Budget Financial Perspective Increase ROCE . ROCE . -7% . -12% Increase cash flow . YTD cash flow from operating activities . -$12M . -$14M Increase gross margin . Gross margin % . 6% . 4% Grow revenues . YTD revenue $1B $0.98 $Increase asset utilization . Asset turnover ratio 1.25 1.23 Customer Perspective Grow market share in economy . Global market share in economy segment . 6% `Lowest Lifetime Cost/Highest $50M . 5.9% segment Quality" campaign Be the low-maintenance-cost . Customer survey: % customers in economy segment that . 80% "Low Maintenance Cost" Campaign $3.5M . 75% supplier in the economy segment rate TWAP as having lowest maintenance costs Gain reputation for standing behind . % of customers who rank company guarantee as "best in . 75% "No Questions Asked" Replacement $75M . 70% quality class" Policy sil George & Plot Anila Keral's Strategy Implementation . at HIM Kozhillede- Be the high-quality provider of auto . Customer survey: % customers in economy segment that . 80% Customer attitudes survey $2.5M . 19% I parts in the economy segment view TWAP as being "excellent" in quality attributes Process Perspective Improve durability of parts . % of parts with top rating for durability . 65% R&D Initiative: Wear Resistant Parts $5M . 63% $ produced . % of parts that "fail in the field" . 7% Low Field Failure Rate Initiative $5M . 7% I Better forecast OEM demand . Stock outs 4% TWAP liaison onsite at customer $1M 2% . Inventory carrying costs (% reduction) 35% 35% Increase useful life of . % of subassemblies passing 10-year life tests . 75% Joint TOM/R&D program for longer $40M . 75% subassemblies useful life of subassemblies Develop closer customer relationships . # of customers with which TWAP has preferred supplier 50 TWAP status review $1M . 60 status Eliminate defects . Reduce defect rates (parts per million) . 5 PPM TOM, lean/kaizen $10M . 4 PPM Improve supplier base and supplier . % of suppliers with an A rating . 75% Supplier optimization program $5M . 78% performance . Reduce avg. delivery time (days 26 25 Learning and Growth Perspective Enhance workforce capabilities in . % of employees certified in TQM capabilities . 50% TOM training $25M 539% Total Quality Management (TQM) . # of TOM engineers hired . 60 TOM hiring program $2M 65 $ Transform workforce into JIT/lean . % of employees receiving JIT & Kaizen training . 50% Kaizen/JIT training $25N 52% $ experts . # of JIT/lean process engineers hired 60 JIT/lean hiring program $2M . 64 Make JIT/lean a priority for all . % of worker pay dependent upon JIT/lean measures . 5% Incentive restructuring $2M 5% I workers USFOR APF 2021 10-Oct 2021 Align information technology to . % increase in IT spending . 20% Upgrade forecasting & supplier data $40M . 20% support TQM and JIT . % of employees who rate information availability base systems "appropriate and adequate" for their process improvement . 40% Employee engagement survey $2M 45%113-030 -12- Balanced Scorecard Action Plan Actual Objectives Measures Target Initiative Budget objectives tronic interchanges . % of orders received and placed through streamlined/EDI . 90% EDI Implementation and Rollout $5M . 95% with customers and suppliers process Program Train buyers on high-quality . % of buyers trained in high-quality procurement processes . 20% Hiring & training programs $50M . 25% procurement Source: Case writers. This document is authorized for use only in Prof. Nycil George & Prof. Anita Kerai's Strategy Implementation. at IIM Kozhikode - EPGP Kozhikode Campus from Apr 2021 to Oct 2021.113-030 TWA Parts [All ridged} makers. Now, I realize that plants in both the United States and Asia serve a high proportion of economy car makers, but I feel strongly that TWAP should focus its resources on Asia, since it is a growing market with great potential. We will close down the plants in the United States, leaving the majority of the facilities in Europe and Asia intact. I believe we can grow our top line by selling more products to our customers in protable segments and win over new customers in new markets, primarily in Asia. Of course, the luxury and economy divisions have very different customers and customervalue propositions [see Exhibit 2}. Based on a competitive analysis conducted by an outside market research firm and an internal analysis of our core competencies, we've decided to differentiate ourselves in the economy division by producing high-quality car parts with the lowest lifetime cost. All of our major competitors in the economy segment focus their strategy on producing parts with the lowest initial cost. We will differentiate ourselves by instead producing highquality parts that will be known in the industry for durability and low maintenance cost. We must make sure that we clearly communicate our value position to auto makers who have built a reputation for durable, high-quality cars in the economy segment. In the luxury division, our strategy will be to produce the most innovative, quality parts in the market. While our major competitors are pursuing a customer integration strategy, we believe that if we focus our efforts on producing the most innovative and technologically superior car parts in the industry, then luxury original equipment manufacturers [OEMs} will come knocking at our door. I'd like to hear from each of you about how your division will help us achieve both our financial goals and our market strategy. Let's start off with you, Joe. Joe Nathan, Bright's newly hired CFO, shared his data with the group: I designed a simple model to pinpoint the critical economic drivers needed to reach our goal of an 8% return on capital employed (ROCEj and positive cash flow by 2011. We forecasted only 54.5 billion in sales in 2009. That means, to cut our negative ROCE from 15% to 4% in one year, we need to reduce our cost of goods sold {COGS} from 95% to 90% in 2009, then to 83% overthe next two years. We need to better utilize our capital assets, both current and new currently we are operating at 65% on old assetsand we must get to 90% utilization on an upgraded and downsized asset base. Finally, we need to get to the lowest cost quartile to compete. Aaron Eckhard, the luxury division president, chimed in: We have always been a leader in product innovation, something our customers continue to value. The innovative products we designed for our highend customers five years ago have started to filter down to the rest of our customer divisions. Satellite radio and Bluetooth capability, for example, are now becoming options for the economy segments. Bright asked Michael Milton, vice president of ma nufacturing, for his perspective. Milton said: Because of the uncertainty in the market, the OEM's production schedules are all over the map, making it nearly impossible to anticipate their volumes, which in turn makes any capacity utilization target extremely difcult to make. In addition, our raw material costs are so unpredictable that it's hard to keep COGS under control. But we need to coordinate supplier management, manufacturing, and product delivery so we can effectively and efficiently get products to the customer. We need to be on time and on spec and reduce raw material costs by This document is authorized for use only in Prof Nycil George '1 Prof. Anita Kerais Strategy Implementation. at IIM Kozhiicode - EPGF' Kozhikode Canpus from Apr 2021 to 0:120:21. TWA Part5 [Abridgedl 113-030 consolidating our product lines, increasing capacity utilization in the remaining plants, and redesigning our products to reduce their materials costs without sacrificing product quality or functionality. We also need to balance our focus on cost cutting with the need to make investments in process improvements and new and upgraded equipment to meet the needs of the luxury car manufacturers. Unscheduled downtime and the inability to make fast product switchovers on the manufacturing floor are killing us. Upgraded capital and preventive maintenance will both reduce our costs and help deliver consistently on time and on spec. Kim Kwon, president of the economy division, added his thoughts: We must master just-in-time {MT} and lean processes in order to gain and retain the economy car OEM customers in Asia. Every single employee must be trained in these processes. Rita Richardson, vice president of research and development, responded to the challenge to produce stateoftheart, technologically sophisticated products: lfwe are to compete in the luxury segment, we certainly need to bring to market new and improved products. In Europe, our customers want us to move fasterwe have to come up with new designs and product innovations to keep up with new regulations on emissions and safety standards and customer needs. To reduce new product development time, we need to invest in new CAD/CAM software, acquire and train skilled design engineers, scientists, and technicians, invest in prototyping equipment, and strip our competitors' products to reverse engineerthose technologies, and acquire those capabilities. Stewart, VP of marketing, added: We must be much more aggressive in signing new customers in Asia and respond betterto the evolving needs of our customer base. Our GEM customers are looking to partner more closely with their suppliers to build fully assembled systems that they can use for final assembly. Finally, we need to showcase the enhanced R810 capabilitythat Rita is talking about by working more closely with our customers to design the products they want and to anticipate changes in production schedules. Milton replied: Yes, I agree that we should work more closely with our customers but I think we're getting ahead of ourselves here with all this commitment to REA). We have to do the basic things right by focusing on efficiencies and quality control at all our plants before we can move to innovation and new customers. We don't have unlimited resources. Richardson rebutted: If you wait on R&D until you have all the factories working awlessly, we'll be so far behind that we'll never catch up." Bright interrupted the argument by saying: We have to be able to be competitive in all these dimensions, but each division will emphasize its own value proposition and an implementation plan and measurements that can keep us on track. We know our overarching strategy is to target the economy and luxury This document is authorized for use only in Prof Nycil George 8' Prof. Anita Kerais Strategy Implementation. at IIM Kozhiicode - EPGF' Kozhikode Canpus from Apr 2021 to 0:120:21. 113-030 TWA Parts [All ridged} segments with low-cost/highquality products and enhanced product innovation. We know our nancial goals are to increase cash flow and ROCE; our customer goals are to increase market share in Europe and Asia. We know we have to improve our internal processes and our employee competency levels to accomplish this. Now we need to decide how to craft implementation plans for each division that will help us reach our goals. I'm very intrigued by the idea of a strategy map and balanced scorecard {EEC}. To create a good BSC, we need to think hard about causeandeffect relationships between the four perspectives. How exactly will utilizing IT, for example, help with product development? These linkages will provide the foundation forthe programs we implement to reach our strategic goals. We must never forget that all of the nonfinancial goals have to be linked to our financial goals. The Balanced Scorecard During the next several weeks, Ron Royerson, the vice president of strategic development, led a small project team to conduct interviews with the corporate VPs and division managers about their customers, competitors, quality initiatives, suppliers, and internal processes. After several long days and weekend retreats, the team was able to complete strategy maps, balanced scorecards, targets, and action plans for the luxury and economy divisions {see Exhibits 3a and 3b for the luxury division, and Exhibits 4a and 4b for the economy division}. Eckhard described his experience crafting the scorecard: l was quite concerned that we should not bite off more than we could chew. I wanted to focus onjust a few important measures that would help us reach ourfinancial targets. Also, I am a great believer that you can effectively focus only on a few things at a time. It may be a cliche, but less is more. Kwon explained why his division had developed a more extensive scorecard: There were many causeandeffect linkages that would become crucial levers for changing behavior and thus enabling our organization to meet our goals. When a pilot flies a plane, he doesn't just worry about altitude; he has to be concerned with airspeed, fuel levels, trajectories, and weather conditions. Like the pilot, we believed that we had to simultaneously manage many factors ifwe wanted to reach our destination. Eckhard and Kwon both knew that the C00 position was vacant and they were both being considered for the job. The division manager with the better performance based on the balanced scorecard was more likely to get the job. Six Months LaterSummer 2009 In July 2009, Bright reviewed the SEC results {see Exhibits 3b and 4b}. She was pleased to see that Eckhard had surpassed his cash flow and profit targets. She noticed that the luxury division's quality indicators had dropped slightly, but it continued to rate highly on innovation. Overall, Eckhard and his division had done a wonderful job exceeding their financial goals, adding to the company's overall financial health, and allowed TWAP to report better results from the prior year, and were also close to target on most of their customer initiatives. On the other hand, the economy division had not attained its nancial targets. Bright was particularly puzzled at the economy division's results This document is authorized for use only in Prof Nycil George 8' Prof. Anita Kerais Strategy Implementation. at IIM Kozhiicode - EPGF' Kozhikode Canpus from Apr 2021 to 0:120:21. TWA Part5 [Abridgedi 113-030 because it had been so successful in the learning and process dimensions. Nevertheless, the division managers had positioned themselves to take advantage of anticipated growth in the economy segment, which would contribute to TWAP's long-term financial performance. As she sat back she thought to herself: "The more I look at these results, the more confused I become. I can't decide which division has performed better." Required 1. Describe the business strategy of each division. 2. Comment on the strategy maps and balanced scorecards of the luxury car division and the economy cardivision. What would you change in the strategy maps and balanced scorecards of each division? 3. \"Mich division manager prepared a better strategymap and balanced scorecard? 4. Which division manager performed better? Explain. This document is authorized for use only in Prof Nycil George 8' Prof. Anita Kerais Strategy Implementation. at IIM Kozhiicode - EPGF' Kozhikode Canpus from Apr 2021to 0:120:21. 113-030 TWA Parts (Abridged) Case Exhibit 1 TWAP Selected Financial Data, by Customer Division (in SUSM), FYE 2008 Product Economy Small to Moderately Luxury (all Truck (all Total Category Midsized Priced segments) segments) Cars/SUVs/CUVs Cars/SUVs/CUVs Revenue $ 2,255 $ 745 $ 2,939 $ 742 $ 6,68 1 COGS 2, 100 899 2,560 801 6.360 SGA 135 244 171 128 678 Operating Income $ 20 $ (398) $ 208 $ (187) $(357) Source: Case writers. 6 This document is authorized for use only in Prof. Nycil George & Prof. Anita Kerai's Strategy Implementation. at IIM Kozhikode - EPGP Kozhikode Campus from Apr 2021 to Oct 2021.113-030 TWA Parts (Abridged) Case Exhibit 2 TWAP Customer Division Value Proposition, December 2008 End-User [or "Consumer"] Defined Mid-size Luxury Economy Attributes (in ranking of importance to end-user) First most important Comfort Innovation Low cost Second most important Low cost Performance Fuel economy Third most important Quality High quality Quality Customer (OEM) Defined Attributes (in ranking of importance to OEM) First most important Price New product innovation Price Second most important Customer service Product design Product quality Third most important On-time delivery Technical expertise JIT/lean Source: Case writers. This document is authorized for use only in Prof. Nycil George & Prof. Anita Kerai's Strategy Implementation. at IIM Kozhikode - EPGP Kozhikode Campus from Apr 2021 to Oct 2021.113-030 TWA Parts (Abridged) Exhibit 3a TWAP Luxury Division Strategy Map, FY 2009 Increase Increase Gross Increase Increase Financial Revenues Margin ROCE Cash Flow Initiate Customer Manage Improve Customer R&D Innovation Customer Partnerships satisfaction Maintain Process Reduce Raw Materials Quality Cost Leadership Learning & Increase Growth Employee Engagement Source: Case writers. 8 This document is authorized for use only in Prof. Nycil George & Prof. Anita Kerai's Strategy Implementation. at IIM Kozhikode - EPGP Kozhikode Campus from Apr 2021 to Oct 2021.113-030 -9- Case Exhibit 3b TWAP Luxury Division Balanced Scorecard, Action Plan, and Results Metrics for Six Months Ending June 30, 2009 (budget figures are for a three-year budget) This document is authorized foruse only in Prod Nysil George- Balanced Scorecard Action Plan Actual Performance Objectives Measures Target Initiative Budget Financial Perspective Increased ROCE . ROCE . 4% Increase cash flow . Year-to-date (YTD) cash flow from operating . -$12M . $8M activities Increase revenue . YTD revenue . 1.38 . 1.28 $ Increase gross margin . Gross margin % 14% 15% Customer Perspective Improve customer satisfaction . Global market share . 5% "Innovation" campaign $50M . 5% Manage innovation . Customer survey: % of customers who consider . 85% Customer attitudes survey $2.5M . 83% TWAP "excellent" at innovation, product design, & technical expertise . Number of new products introduced 50 New product launch $50M . 50 Initiate customer R&D partnerships . Number of customers with whom TWAP partners . 20 Partnership initiative $10M 10 to research and develop new products Process Perspective Reduce raw materials cost . Cost of raw materials (% of revenue . 65% Supplier optimization program $5M . 60% Maintain quality leadership . Reduce defect rates (per 1 million parts) . 3 PPM TQM initiative $10M . 5 PPM Learning and Growth Perspective Increase employee engagement % of employees "very satisfied" with the . 809 Employee engagement and $25M . 629 resources they have to do their job (annual satisfaction ratings survey). . % of employees "very satisfied" with the training . 80% . 65% they received in the past 12 months. Anita Kerai's Strategy Implementation. at IIM Kozhikede - EPGP Kozhikode Campus from Apr 2021 to Oct 2021. Source: Case writers
