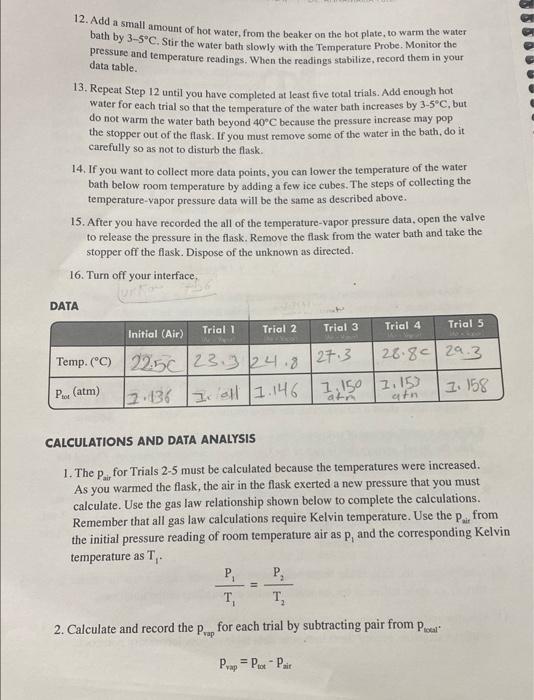
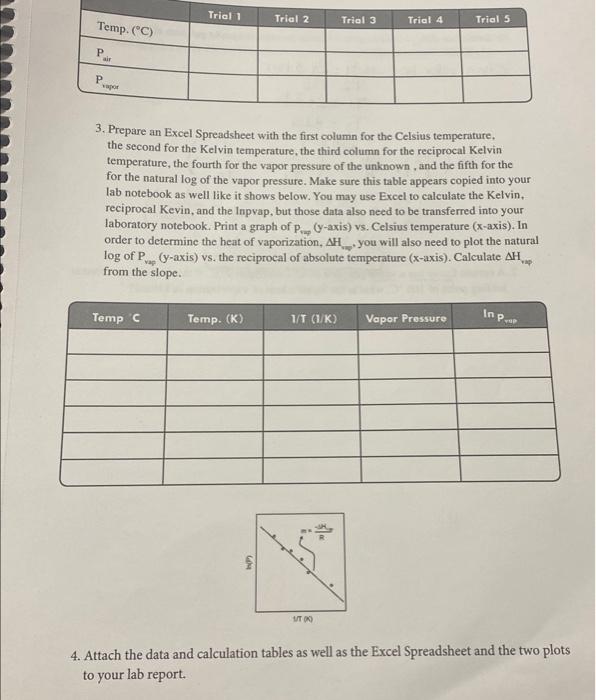
12. Add a small amount of hot water, from the beaker on the hot plate, to warm the water bath by 35C. Stir the water bath slowly with the Temperature Probe. Monitor the pressure and temperature readings. When the readings stabilize, record them in your data table. 13. Repeat Step 12 until you have completed at least five total trials. Add enough hot water for each trial so that the temperature of the water bath increases by 35C, but do not warm the water bath beyond 40C because the pressure increase may pop the stopper out of the flask. If you must remove some of the water in the bath, do it carefully so as not to disturb the flask. 14. If you want to collect more data points, you can lower the temperature of the water bath below room temperature by adding a few ice cubes. The steps of collecting the temperature-vapor pressure data will be the same as described above. 15. After you have recorded the all of the temperature-vapor pressure data, open the valve to release the pressure in the flask. Remove the flask from the water bath and take the stopper off the flask. Dispose of the unknown as directed. 16. Turn off your interface, CALCULATIONS AND DATA ANALYSIS 1. The pair for Trials 25 must be calculated because the temperatures were increased. As you warmed the flask, the air in the flask exerted a new pressure that you must calculate. Use the gas law relationship shown below to complete the calculations. Remember that all gas law calculations require Kelvin temperature. Use the pair from the initial pressure reading of room temperature air as p1 and the corresponding Kelvin temperature as T1. T1P1=T2P2 2. Calculate and record the pvap for each trial by subtracting pair from ptooal. Prap=ptotPair 3. Prepare an Excel Spreadsheet with the first column for the Celsius temperature, the second for the Kelvin temperature, the third column for the reciprocal Kelvin temperature, the fourth for the vapor pressure of the unknown, and the fifth for the for the natural log of the vapor pressure. Make sure this table appears copied into your lab notebook as well like it shows below. You may use Excel to calculate the Kelvin, reciprocal Kevin, and the Inpvap, but those data also need to be transferred into your laboratory notebook. Print a graph of pve ( (y-axis) vs. Celsius temperature ( x-axis). In order to determine the heat of vaporization, AHF, you will also need to plot the natural log of Pvap ( y-axis) vs. the reciprocal of absolute temperature (x-axis). Calculate Huup from the slope. 4. Attach the data and calculation tables as well as the Excel Spreadsheet and the two plots to your lab report


