Answered step by step
Verified Expert Solution
Link Copied!

Question

1 Approved Answer

12. Betty's financial advisor has picked two investments for her portfolio Sunshine company that sells summer clothes, hats and sunglasses Rainbow company that sells winter
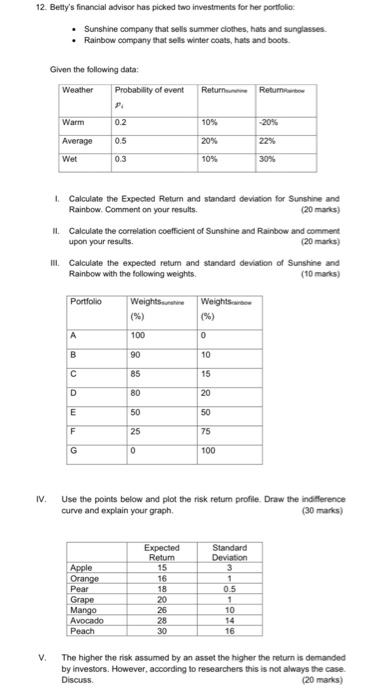
image text in transcribed
12. Betty's financial advisor has picked two investments for her portfolio Sunshine company that sells summer clothes, hats and sunglasses Rainbow company that sells winter coats, hats and boots. Given the following data: Weather Probability of event Returnu Returnbow Warm 0.2 -20% 22% Average Wet 03 30% 1. Calculate the expected Return and standard deviation for Sunshine and Rainbow. Comment on your results (20 marks) II. Calculate the correlation coefficient of Sunshine and Rainbow and comment upon your results (20 marks) III. Calculate the expected return and standard deviation of Sunshine and Rainbow with the following weights. (10 marks) Portfolio Weights sunshine Weight (%) IV. Use the points below and plot the risk return profile. Draw the indifference curve and explain your graph. (30 marks) Expected Retum Standard Deviation Apple Orange 18 0.5 Grape Mango Avocado Peach SX The higher the risk assumed by an asset the higher the return is demanded by investors. However, according to researchers this is not always the case Discuss (20 marks) 12. Betty's financial advisor has picked two investments for her portfolio Sunshine company that sells summer clothes, hats and sunglasses Rainbow company that sells winter coats, hats and boots. Given the following data: Weather Probability of event Returnu Returnbow Warm 0.2 -20% 22% Average Wet 03 30% 1. Calculate the expected Return and standard deviation for Sunshine and Rainbow. Comment on your results (20 marks) II. Calculate the correlation coefficient of Sunshine and Rainbow and comment upon your results (20 marks) III. Calculate the expected return and standard deviation of Sunshine and Rainbow with the following weights. (10 marks) Portfolio Weights sunshine Weight (%) IV. Use the points below and plot the risk return profile. Draw the indifference curve and explain your graph. (30 marks) Expected Retum Standard Deviation Apple Orange 18 0.5 Grape Mango Avocado Peach SX The higher the risk assumed by an asset the higher the return is demanded by investors. However, according to researchers this is not always the case Discuss (20 marks)

Step by Step Solution

There are 3 Steps involved in it

Step: 1

blur-text-image

Get Instant Access to Expert-Tailored Solutions

See step-by-step solutions with expert insights and AI powered tools for academic success

Step: 2

blur-text-image_2

Step: 3

blur-text-image_3

Ace Your Homework with AI

Get the answers you need in no time with our AI-driven, step-by-step assistance

Get Started

Recommended Textbook for

Securities Trader Qualification Examination Series 57 Study Guide

Authors: Philip Martin Mccaulay

1st Edition

979-8363665240

More Books

Students also viewed these Finance questions