

Answered step by step
Verified Expert Solution
Question
1 Approved Answer
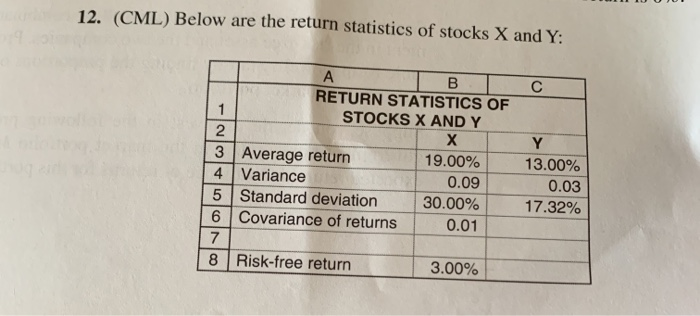
12. (CML) Below are the return statistics of stocks X and Y: BC RETURN STATISTICS OF STOCKS X AND Y 4 3 Average return Variance
Step by Step Solution
There are 3 Steps involved in it
Step: 1

Get Instant Access to Expert-Tailored Solutions
See step-by-step solutions with expert insights and AI powered tools for academic success
Step: 2

Step: 3
Ace Your Homework with AI
Get the answers you need in no time with our AI-driven, step-by-step assistance
Get Started
Communication Essentials For Financial Planners
Authors: John E. Grable
1st Edition
1119350786, 978-1119350781