

Answered step by step
Verified Expert Solution
Question
1 Approved Answer
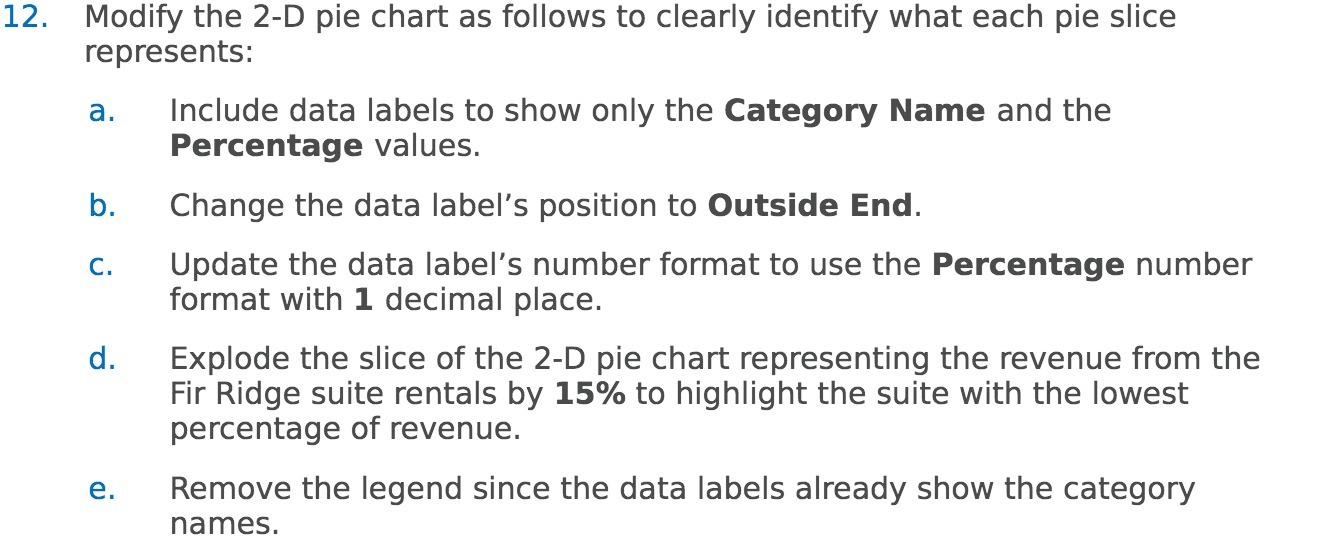
12. Modify the 2D pie chart as follows to clearly identify what each pie slice represents: a. Include data labels to show only the Category
Step by Step Solution
There are 3 Steps involved in it
Step: 1

Get Instant Access to Expert-Tailored Solutions
See step-by-step solutions with expert insights and AI powered tools for academic success
Step: 2

Step: 3
Ace Your Homework with AI
Get the answers you need in no time with our AI-driven, step-by-step assistance
Get Started
An Introduction to Measure Theoretic Probability
Authors: George G. Roussas
2nd edition
128000422, 978-0128000427