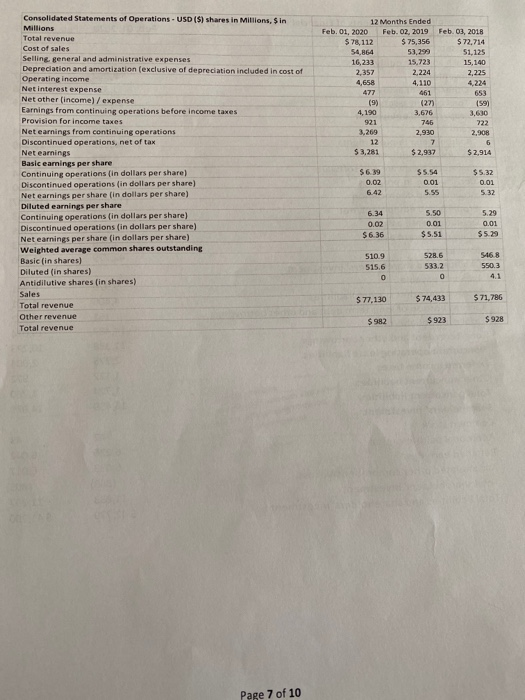
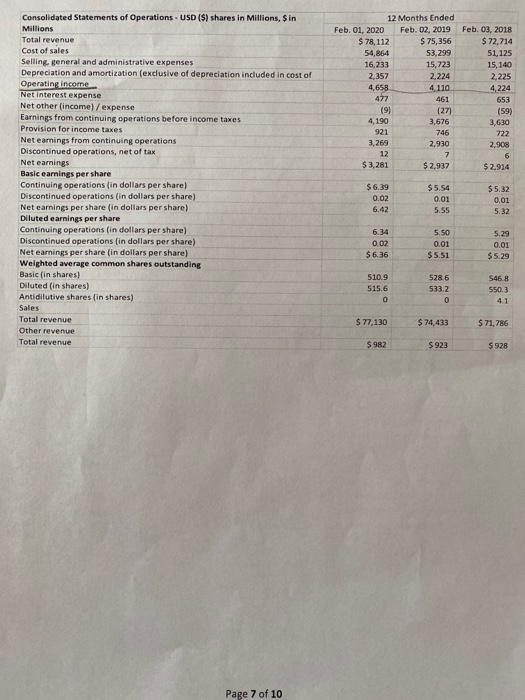
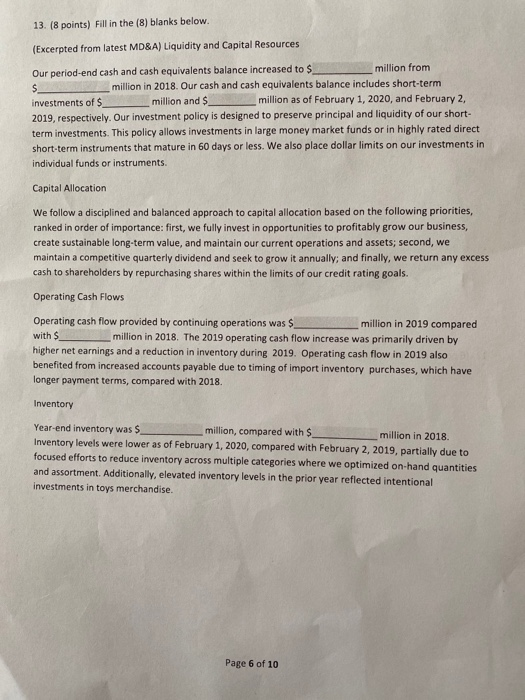
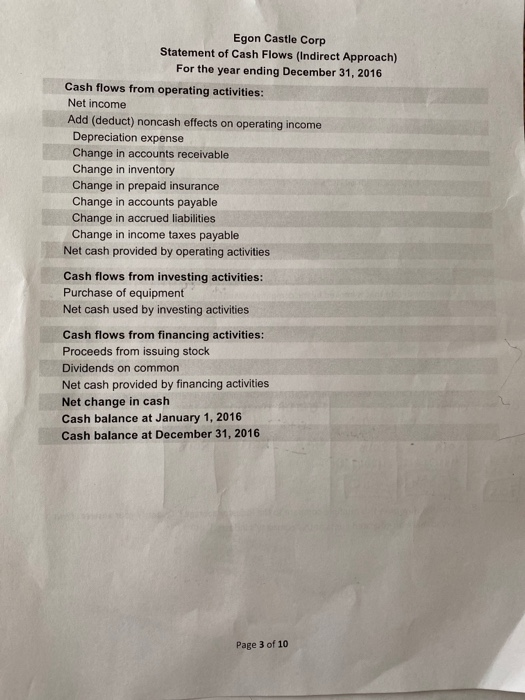
12 Months Ended Feb. 01, 2020 Feb. 02, 2019 $78,112 $ 75,356 54,864 53,299 16,233 15.723 2,357 2,224 4,110 461 (27) 4,190 3,676 746 3.269 2,930 Feb. 03, 2018 $ 72,714 51,125 15,140 2,225 4224 653 (9) 3.630 2,508 $ 3.281 $2.937 $ 2,914 Consolidated Statements of Operations - USD (S) shares in Millions, Sin Millions Total revenue Cost of sales Selling general and administrative expenses Depreciation and amortization (exclusive of depreciation included in cost of Operating income Net interest expense Net other (income) / expense Earnings from continuing operations before income taxes Provision for income taxes Net earnings from continuing operations Discontinued operations, net of tax Net earnings Basic earnings per share Continuing operations (in dollars per share) Discontinued operations in dollars per share) Net earnings per share (in dollars per share) Diluted earnings per share Continuing operations (in dollars per share) Discontinued operations (in dollars per share) Net earnings per share (in dollars per share) Weighted average common shares outstanding Basic (in shares) Diluted in shares) Antidilutive shares (in shares) Sales Total revenue Other revenue Total revenue 0.02 $5.50 0.01 5.55 $5.32 0.01 5.32 5.29 6.34 0.02 $6.36 5.50 0.01 $5.51 0.01 $5.29 510.9 515.6 526 533.2 546.8 550.3 $ 77,130 $ 74,433 $ 71,786 $ 982 $ 923 $928 Page 7 of 10 10 points) Reform Feb. 01, 2020 Feb. 02, 2019 $ 2,577 8,992 1,333 12,902 $ 1,556 9,497 1,466 12,519 6,036 30,603 6,083 2,692 533 (19,664) 26,283 2,236 1,358 42,779 6,064 29,240 5,912 2,544 460 (18,687) 25,533 1,965 1,273 41,290 Consolidated Statements of Financial Position - USD ($) $ in Millions Assets Cash and cash equivalents Inventory Other current assets Total current assets Property and equipment Land Buildings and improvements Fixtures and equipment Computer hardware and software Construction-in-progress Accumulated depreciation Property and equipment, net Operating lease assets Other noncurrent assets Total assets Liabilities and shareholders' investment Accounts payable Accrued and other current liabilities Current portion of long-term debt and other borrowings Total current liabilities Long-term debt and other borrowings Noncurrent operating lease liabilities Deferred income taxes Other noncurrent liabilities Total noncurrent liabilities Shareholders' investment Common stock Additional paid-in capital Retained earnings Accumulated other comprehensive loss Total shareholders' investment Total liabilities and shareholders' investment 9,920 4,406 161 14,487 11,338 2,275 1,122 1,724 16,459 9,761 4,201 1,052 15,014 10,223 2,004 972 1,780 14,979 42 6,226 6,433 (868) 11,833 $ 42,779 43 6,042 6,017 (805) 11,297 $ 41,290 12 Months Ended Feb. 01, 2020 Feb 02, 2019 Feb 03, 2018 $ 3.281 $ 2,937 $ 2,914 3.269 2,930 2.908 2,604 147 2,475 2.474 132 322 178 10 (188) 1900) (2999 (348 (156) 1,307 1.127 7.099 5,970 6,61 7,117 5,973 6.935 Consolidated Statements of Cash Flows. USD (5) Sin Millions Operating activities Net earnings Earnings from discontinued operations, net of tax Net earnings from continuing operations Adjustments to reconcile net earnings to cash provided by operations Depreciation and amortization Share-based compensation expense Deferred income taxes Loss an debt extinguishment Noncash losses/gains) and other net Changes in operating accounts: Inventory Other assets Accounts payable Accrued and other liabilities Cash provided by operating activities-continuing operations Cash provided by operating activities--discontinued operations Cash provided by operations Investing activities Expenditures for property and equipment Proceeds from disposal of property and equipment Cash paid for acquisitions, net of cash assumed Other investments Cash required for investing activities Financing activities Additions to long-term debt Reductions of long-term debt Dividends pald Repurchase of stock Stock option exercises Cash required for financing activities Net (decrease) / increase in cash and cash equivalents Cash and cash equivalents at beginning of period Cash and cash equivalents at end of period Supplemental information Interest paid, net of capitalized interest Income taxes paid Leased assets obtained in exchange for new finance lease liabilities Leased assets obtained in exchange for new operating lease liabilities (3,027) 13,516) (2,533) 1952 (2,944) (3.416) (3,075) 1,739 (2,069) (1,330) (1.565) (281) (1,335) (2,124) (2.192) (1.338 (1.046) 108 (3,152) (3,729) 1,021 (3,644) (1,087 2,643 1.556 1.556 2,577 2.512 2.643 492 373 696 379 $ 454 130 $ 246 678 934 139 $ 212 Hem & Selected Financial Data Selected Financial Data milions, except per share data) Sales Total revenue 2019 77,130 $ 78,112 For the Fiscal Year 2017 2016 2015 2016 AR A LAS As Aduste 74,433 $ 71,785 $ 69,414 $ 73,717 75,356 72,714 70,271 74,494 3,269 2.930 2,666 Net Earnings Continuing operations Discontinued operations Net earnings 12 2,908 8 2,914 3,321 42 3.363 3,281 2,937 2.734 6.39 5.32 0.01 5.32 481 012 5.29 007 0.02 4.73 Basic Earnings Per Share Continuing operations Discontinued operations Basic earings per share Diluted Earnings Per Share Continung operations Discontinued operations Diluted earnings per share Cash dividends declared per share 4.58 0.01 5.29 0.12 4.69 531 2.46 2.36 220 7. Cash and Cash Equivalents Cash equivalents include highly liquid investments with an original maturity of three months or less from the time of purchase. Cash equivalents also include amounts due from third-party financial institutions for credit and debit card transactions. These receivables typically settle in five days or less 441 Cash and Cash Equivalents February 1. February 2 2020 2019 Cash 326 $ 359 Short-term investments 1.810 769 Receivables from third-party financial institutions for credit and debit card transactions Cash and cash equivalents $ 2.577 $ 1.556 We have access to these funds without any significant restrictions, taxes or penalties As of February 1, 2020 and February 2, 2019, we reclassified book overdrafts of $200 million and $242 million, respectively, to Accounts Payable and 523 million and $25 million, respectively. to Accrued and Other Current Liabilities Refer to the selected financial statements and notes on pages 7-10 4. (6 points) Calculate quality of earnings ratio for 2019, 2018 and 2017. What can you conclude from your calculations? 5. (10 points) Using inputs solely from the cash flow statement, calculate the company's FCF for 2019. 6. (6 points) Using a market cap of $48.28, and assuming a cost of equity of 11%, calculate the long term growth rate that is implied by the company's valuation. 7. (12 points) Calculate the company's EBITDA, EBITDA margin and EBITDA multiple. 8. (4 points) How does this multiple compare to the industry average? Quantify your answer. (You have to make an educated guess at this company's industry) 9. (6 points) Refer to item 6 Selected Financial Data. Calculate the dividend payout ratio for the last 5 years. 10. (2 points) Calculate the current dividend yield based on a stock price of $96. 11. (3 points) Calculate the Company's PE. price per share PE Earnings Per share 12. (6 points) Calculate the gross margin for the past 3 years. 13. (8 points) Fill in the (8) blanks below. (Excerpted from latest MD&A) Liquidity and Capital Resources $ Our period-end cash and cash equivalents balance increased to s million from million in 2018. Our cash and cash equivalents balance includes short-term investments of million and $_ million as of February 1, 2020, and February 2, 2019, respectively. Our investment policy is designed to preserve principal and liquidity of our short- term investments. This policy allows investments in large money market funds or in highly rated direct short-term instruments that mature in 60 days or less. We also place dollar limits on our investments in individual funds or instruments. Capital Allocation We follow a disciplined and balanced approach to capital allocation based on the following priorities, ranked in order of importance: first, we fully invest in opportunities to profitably grow our business, create sustainable long-term value, and maintain our current operations and assets; second, we maintain a competitive quarterly dividend and seek to grow it annually; and finally, we return any excess cash to shareholders by repurchasing shares within the limits of our credit rating goals. Operating Cash Flows Operating cash flow provided by continuing operations was $ million in 2019 compared with $ million in 2018. The 2019 operating cash flow increase was primarily driven by higher net earnings and a reduction in inventory during 2019. Operating cash flow in 2019 also benefited from increased accounts payable due to timing of import inventory purchases, which have longer payment terms, compared with 2018. Inventory Year-end inventory was $ million, compared with $ million in 2018. Inventory levels were lower as of February 1, 2020, compared with February 2, 2019, partially due to focused efforts to reduce inventory across multiple categories where we optimized on-hand quantities and assortment. Additionally, elevated inventory levels in the prior year reflected intentional investments in toys merchandise. 12 Months Ended Feb. 01, 2020 Feb. 02. 2019 $ 78,112 $ 75,356 54,864 53,299 16,233 15,723 2,357 2,224 4,658 4. 110 461 (9) 4,190 3,676 921 746 3,269 2.930 Feb. 03, 2018 $ 72,714 51,125 15,140 2,225 4,224 653 (271) (59) 3,630 722 2,908 $3,281 $ 2,937 $2.914 Consolidated Statements of Operations - USD ($) shares in Millions, $ in Millions Total revenue Cost of sales Selling general and administrative expenses Depreciation and amortization (exclusive of depreciation included in cost of Operating income Net interest expense Net other income) / expense Earnings from continuing operations before income taxes Provision for income taxes Net earnings from continuing operations Discontinued operations, net of tax Net earnings Basic earnings per share Continuing operations in dollars per share) Discontinued operations (in dollars per share) Net earnings per share (in dollars per share) Diluted earnings per share Continuing operations (in dollars per share) Discontinued operations (in dollars per share) Net earnings per share (in dollars per share) Weighted average common shares outstanding Basic (in shares) Diluted (in shares) Antidilutive shares in shares) Sales Total revenue Other revenue Total revenue $6.39 0.02 6.42 $5.54 0.01 5.55 $5.32 0.01 5.32 5.50 6.34 0.02 $ 6.36 0.01 5.29 0.01 $5.29 $5.51 510.9 515.6 528.6 533.2 546.8 550.3 $77,130 $ 74,433 $ 71,786 $ 982 $ 923 $ 928 Page 7 of 10 Feb. 01, 2020 Feb. 02, 2019 $ 2,577 8,992 1,333 12,902 $ 1,556 9,497 1,466 12,519 Consolidated Statements of Financial Position - USD ($) Sin Millions Assets Cash and cash equivalents Inventory Other current assets Total current assets Property and equipment Land Buildings and improvements Fixtures and equipment Computer hardware and software Construction-in-progress Accumulated depreciation Property and equipment, net Operating lease assets Other noncurrent assets Total assets Liabilities and shareholders' investment Accounts payable Accrued and other current liabilities Current portion of long-term debt and other borrowings Total current liabilities Long-term debt and other borrowings Noncurrent operating lease liabilities Deferred income taxes Other noncurrent liabilities Total noncurrent liabilities Shareholders' investment Common stock Additional paid in capital Retained earnings Accumulated other comprehensive loss Total shareholders' investment Total liabilities and shareholders'investment 6,036 30,603 6,083 2,692 533 (19,664) 26,283 2,236 1,358 42,779 6,064 29,240 5,912 2,544 460 (18,687) 25,533 1,965 1,273 41,290 9,920 4,406 161 14,487 11,338 2,275 1,122 1,724 16,459 9,761 4,201 1,052 15,014 10,223 2,004 972 1,780 14,979 42 6,226 6,433 (868) 11.833 $ 42,779 43 6,042 6,017 (805) 11,297 $ 41,290 Page 8 of 10 12 Months Ended Feb. 01, 2020 Feb. 02, 2019 Feb. 03, 2018 $3,281 $ 2.937 $ 2,914 3,269 2.930 2.908 Consolidated Statements of Cash Flows - USD (S) Sin Millions Operating activities Net earnings Earnings from discontinued operations, net of tax Net earnings from continuing operations Adjustments to reconcile net earnings to cash provided by operations: Depreciation and amortization Share-based compensation expense Deferred income taxes Loss on debt extinguishment Noncash losses / trains) and other net Changes in operating accounts: 2,604 147 178 2.474 132 322 2,476 112 (188) 123 95 208 SOS (900) (299) 1,127 (348) (156) 1,307 140 199 7.099 419 5,970 6.861 74 7.117 5,973 6,935 (3,027) (3,516) (2.533) 15 (518) (55) (3,075) (2.944) (3,416) Other assets Accounts payable Accrued and other liabilities Cash provided by operating activities-continuing operations Cash provided by operating activities-discontinued operations Cash provided by operations Investing activities Expenditures for property and equipment Proceeds from disposal of property and equipment Cash paid for acquisitions, net of cash assumed Other investments Cash required for investing activities Financing activities Additions to long-term debt Reductions of long-term debt Dividends paid Repurchase of stock Stock option exercises Cash required for financing activities Net (decrease) /increase in cash and cash equivalents Cash and cash equivalents at beginning of period Cash and cash equivalents at end of period Supplemental information Interest paid, net of capitalized interest Income taxes paid Leased assets obtained in exchange for new finance lease liabilities Leased assets obtained in exchange for new operating lease liabilities 1,739 (2,069) (1,330) (1,565) (281) (1,335) (2,124) 739 (2,192) (1,338) (1,046) 96 108 (3,152) 1,021 1,556 2,577 (3,644) (1,087) 2.643 1,556 (3,729) 131 2,512 2.643 492 476 696 379 678 934 139 $ 212 $ 464 130 $ 246 Page 9 of 10 Hem Selected Financial Data Selected Financial Data For the Fiscal Year 2017 2016 2015 ons, except per share data 2019 77,130 S 78,112 $ $ 74 433 5 75,356 71,786 72.714 69,414 70,271 73,717 74.414 2.930 2.900 2.666 3,321 2,937 Net Earnings Corting operations Discontinued operations Neteams Basic Earnings Per Share Corbung operations Discontinued operations Basic earings per share 4.81 0.12 0.07 532 4.73 Diluted Earnings Per Share Continue operations Discontinued operations Diluted earnings per share 4.58 0.12 Cash dividends declared per share 2.36 7. Cash and Cash Equivalents Cash equivalents include highly liquid investments with an original maturity of three months or less from the time of purchase. Cash equivalents also include amounts due from third-party financial institutions for credit and debit card transactions. These receivables typically settle in five days or less mons) 1,810 Cash and Cash Equivalents February 1, February 2 2020 2019 Cash 326 Short-term investments 789 Receivables from third-party financial institutions for credit and debit card transactions Cash and cash equivalents 2,577 5 1,556 - We have access to these funds without any significant restrictions, taxes or penalties As of February 1, 2020 and February 2, 2019, we reclassified book overdrafts of $209 million and 5242 milion respectively to Accounts Payable and $23ion and 525 million, respectively to Accrued and Other Current Lists 441 Page 10 of 10 Refer to the selected financial statements and notes on pages 7-10 4. (6 points) Calculate quality of earnings ratio for 2019, 2018 and 2017. What can you conclude from your calculations? 5. (10 points) Using inputs solely from the cash flow statement, calculate the company's FCF for 2019. 6. (6 points) Using a market cap of $48.28, and assuming a cost of equity of 11%, calculate the long term growth rate that is implied by the company's valuation. 7. (12 points) Calculate the company's EBITDA, EBITDA margin and EBITDA multiple. BJTDA - Operating income EBITDA mayin EBITDA + deprication and Revenue Amortization 2019 2018 2020 2019 2018 1658+ -4110.12224 = 4224+2225 235+ - 68341 H 64501 7015 8. (4 points) How does this multiple compare to the industry average? Quantify your answer. (You have to make an educated guess at this company's industry) Page 4 of 10 9. (6 points) Refer to Item 6 Selected Financial Data Calculate the dividend payout ratio for the last 5 years. 10. (2 points) Calculate the current dividend yield based on a stock price of $96. 11. (3 points) Calculate the Company's PE. Price per sharo PE Earnings Per share 12. (6 points) Calculate the gross margin for the past 3 years. Page 5 of 10 13. (8 points) Fill in the (8) blanks below. (Excerpted from latest MD&A) Liquidity and Capital Resources Our period-end cash and cash equivalents balance increased to $ million from million in 2018. Our cash and cash equivalents balance includes short-term investments of $ million and $ million as of February 1, 2020, and February 2, 2019, respectively. Our investment policy is designed to preserve principal and liquidity of our short- term investments. This policy allows investments in large money market funds or in highly rated direct short-term instruments that mature in 60 days or less. We also place dollar limits on our investments in individual funds or instruments Capital Allocation We follow a disciplined and balanced approach to capital allocation based on the following priorities, ranked in order of importance: first, we fully invest in opportunities to profitably grow our business, create sustainable long-term value, and maintain our current operations and assets; second, we maintain a competitive quarterly dividend and seek to grow it annually; and finally, we return any excess cash to shareholders by repurchasing shares within the limits of our credit rating goals. Operating Cash Flows Operating cash flow provided by continuing operations was $ million in 2019 compared with $ million in 2018. The 2019 operating cash flow increase was primarily driven by higher net earnings and a reduction in inventory during 2019. Operating cash flow in 2019 also benefited from increased accounts payable due to timing of import inventory purchases, which have longer payment terms, compared with 2018. Inventory Year-end inventory was _million, compared with $ _million in 2018. Inventory levels were lower as of February 1, 2020, compared with February 2, 2019, partially due to focused efforts to reduce inventory across multiple categories where we optimized on hand quantities and assortment. Additionally, elevated inventory levels in the prior year reflected intentional investments in toys merchandise. Page 6 of 10 Egon Castle Corp Statement of Cash Flows (Indirect Approach) For the year ending December 31, 2016 Cash flows from operating activities: Net income Add (deduct) noncash effects on operating income Depreciation expense Change in accounts receivable Change in inventory Change in prepaid insurance Change in accounts payable Change in accrued liabilities Change in income taxes payable Net cash provided by operating activities Cash flows from investing activities: Purchase of equipment Net cash used by investing activities Cash flows from financing activities: Proceeds from issuing stock Dividends on common Net cash provided by financing activities Net change in cash Cash balance at January 1, 2016 Cash balance at December 31, 2016 Page 3 of 10 12 Months Ended Feb. 01, 2020 Feb. 02, 2019 $78,112 $ 75,356 54,864 53,299 16,233 15.723 2,357 2,224 4,110 461 (27) 4,190 3,676 746 3.269 2,930 Feb. 03, 2018 $ 72,714 51,125 15,140 2,225 4224 653 (9) 3.630 2,508 $ 3.281 $2.937 $ 2,914 Consolidated Statements of Operations - USD (S) shares in Millions, Sin Millions Total revenue Cost of sales Selling general and administrative expenses Depreciation and amortization (exclusive of depreciation included in cost of Operating income Net interest expense Net other (income) / expense Earnings from continuing operations before income taxes Provision for income taxes Net earnings from continuing operations Discontinued operations, net of tax Net earnings Basic earnings per share Continuing operations (in dollars per share) Discontinued operations in dollars per share) Net earnings per share (in dollars per share) Diluted earnings per share Continuing operations (in dollars per share) Discontinued operations (in dollars per share) Net earnings per share (in dollars per share) Weighted average common shares outstanding Basic (in shares) Diluted in shares) Antidilutive shares (in shares) Sales Total revenue Other revenue Total revenue 0.02 $5.50 0.01 5.55 $5.32 0.01 5.32 5.29 6.34 0.02 $6.36 5.50 0.01 $5.51 0.01 $5.29 510.9 515.6 526 533.2 546.8 550.3 $ 77,130 $ 74,433 $ 71,786 $ 982 $ 923 $928 Page 7 of 10 10 points) Reform Feb. 01, 2020 Feb. 02, 2019 $ 2,577 8,992 1,333 12,902 $ 1,556 9,497 1,466 12,519 6,036 30,603 6,083 2,692 533 (19,664) 26,283 2,236 1,358 42,779 6,064 29,240 5,912 2,544 460 (18,687) 25,533 1,965 1,273 41,290 Consolidated Statements of Financial Position - USD ($) $ in Millions Assets Cash and cash equivalents Inventory Other current assets Total current assets Property and equipment Land Buildings and improvements Fixtures and equipment Computer hardware and software Construction-in-progress Accumulated depreciation Property and equipment, net Operating lease assets Other noncurrent assets Total assets Liabilities and shareholders' investment Accounts payable Accrued and other current liabilities Current portion of long-term debt and other borrowings Total current liabilities Long-term debt and other borrowings Noncurrent operating lease liabilities Deferred income taxes Other noncurrent liabilities Total noncurrent liabilities Shareholders' investment Common stock Additional paid-in capital Retained earnings Accumulated other comprehensive loss Total shareholders' investment Total liabilities and shareholders' investment 9,920 4,406 161 14,487 11,338 2,275 1,122 1,724 16,459 9,761 4,201 1,052 15,014 10,223 2,004 972 1,780 14,979 42 6,226 6,433 (868) 11,833 $ 42,779 43 6,042 6,017 (805) 11,297 $ 41,290 12 Months Ended Feb. 01, 2020 Feb 02, 2019 Feb 03, 2018 $ 3.281 $ 2,937 $ 2,914 3.269 2,930 2.908 2,604 147 2,475 2.474 132 322 178 10 (188) 1900) (2999 (348 (156) 1,307 1.127 7.099 5,970 6,61 7,117 5,973 6.935 Consolidated Statements of Cash Flows. USD (5) Sin Millions Operating activities Net earnings Earnings from discontinued operations, net of tax Net earnings from continuing operations Adjustments to reconcile net earnings to cash provided by operations Depreciation and amortization Share-based compensation expense Deferred income taxes Loss an debt extinguishment Noncash losses/gains) and other net Changes in operating accounts: Inventory Other assets Accounts payable Accrued and other liabilities Cash provided by operating activities-continuing operations Cash provided by operating activities--discontinued operations Cash provided by operations Investing activities Expenditures for property and equipment Proceeds from disposal of property and equipment Cash paid for acquisitions, net of cash assumed Other investments Cash required for investing activities Financing activities Additions to long-term debt Reductions of long-term debt Dividends pald Repurchase of stock Stock option exercises Cash required for financing activities Net (decrease) / increase in cash and cash equivalents Cash and cash equivalents at beginning of period Cash and cash equivalents at end of period Supplemental information Interest paid, net of capitalized interest Income taxes paid Leased assets obtained in exchange for new finance lease liabilities Leased assets obtained in exchange for new operating lease liabilities (3,027) 13,516) (2,533) 1952 (2,944) (3.416) (3,075) 1,739 (2,069) (1,330) (1.565) (281) (1,335) (2,124) (2.192) (1.338 (1.046) 108 (3,152) (3,729) 1,021 (3,644) (1,087 2,643 1.556 1.556 2,577 2.512 2.643 492 373 696 379 $ 454 130 $ 246 678 934 139 $ 212 Hem & Selected Financial Data Selected Financial Data milions, except per share data) Sales Total revenue 2019 77,130 $ 78,112 For the Fiscal Year 2017 2016 2015 2016 AR A LAS As Aduste 74,433 $ 71,785 $ 69,414 $ 73,717 75,356 72,714 70,271 74,494 3,269 2.930 2,666 Net Earnings Continuing operations Discontinued operations Net earnings 12 2,908 8 2,914 3,321 42 3.363 3,281 2,937 2.734 6.39 5.32 0.01 5.32 481 012 5.29 007 0.02 4.73 Basic Earnings Per Share Continuing operations Discontinued operations Basic earings per share Diluted Earnings Per Share Continung operations Discontinued operations Diluted earnings per share Cash dividends declared per share 4.58 0.01 5.29 0.12 4.69 531 2.46 2.36 220 7. Cash and Cash Equivalents Cash equivalents include highly liquid investments with an original maturity of three months or less from the time of purchase. Cash equivalents also include amounts due from third-party financial institutions for credit and debit card transactions. These receivables typically settle in five days or less 441 Cash and Cash Equivalents February 1. February 2 2020 2019 Cash 326 $ 359 Short-term investments 1.810 769 Receivables from third-party financial institutions for credit and debit card transactions Cash and cash equivalents $ 2.577 $ 1.556 We have access to these funds without any significant restrictions, taxes or penalties As of February 1, 2020 and February 2, 2019, we reclassified book overdrafts of $200 million and $242 million, respectively, to Accounts Payable and 523 million and $25 million, respectively. to Accrued and Other Current Liabilities Refer to the selected financial statements and notes on pages 7-10 4. (6 points) Calculate quality of earnings ratio for 2019, 2018 and 2017. What can you conclude from your calculations? 5. (10 points) Using inputs solely from the cash flow statement, calculate the company's FCF for 2019. 6. (6 points) Using a market cap of $48.28, and assuming a cost of equity of 11%, calculate the long term growth rate that is implied by the company's valuation. 7. (12 points) Calculate the company's EBITDA, EBITDA margin and EBITDA multiple. 8. (4 points) How does this multiple compare to the industry average? Quantify your answer. (You have to make an educated guess at this company's industry) 9. (6 points) Refer to item 6 Selected Financial Data. Calculate the dividend payout ratio for the last 5 years. 10. (2 points) Calculate the current dividend yield based on a stock price of $96. 11. (3 points) Calculate the Company's PE. price per share PE Earnings Per share 12. (6 points) Calculate the gross margin for the past 3 years. 13. (8 points) Fill in the (8) blanks below. (Excerpted from latest MD&A) Liquidity and Capital Resources $ Our period-end cash and cash equivalents balance increased to s million from million in 2018. Our cash and cash equivalents balance includes short-term investments of million and $_ million as of February 1, 2020, and February 2, 2019, respectively. Our investment policy is designed to preserve principal and liquidity of our short- term investments. This policy allows investments in large money market funds or in highly rated direct short-term instruments that mature in 60 days or less. We also place dollar limits on our investments in individual funds or instruments. Capital Allocation We follow a disciplined and balanced approach to capital allocation based on the following priorities, ranked in order of importance: first, we fully invest in opportunities to profitably grow our business, create sustainable long-term value, and maintain our current operations and assets; second, we maintain a competitive quarterly dividend and seek to grow it annually; and finally, we return any excess cash to shareholders by repurchasing shares within the limits of our credit rating goals. Operating Cash Flows Operating cash flow provided by continuing operations was $ million in 2019 compared with $ million in 2018. The 2019 operating cash flow increase was primarily driven by higher net earnings and a reduction in inventory during 2019. Operating cash flow in 2019 also benefited from increased accounts payable due to timing of import inventory purchases, which have longer payment terms, compared with 2018. Inventory Year-end inventory was $ million, compared with $ million in 2018. Inventory levels were lower as of February 1, 2020, compared with February 2, 2019, partially due to focused efforts to reduce inventory across multiple categories where we optimized on-hand quantities and assortment. Additionally, elevated inventory levels in the prior year reflected intentional investments in toys merchandise. 12 Months Ended Feb. 01, 2020 Feb. 02. 2019 $ 78,112 $ 75,356 54,864 53,299 16,233 15,723 2,357 2,224 4,658 4. 110 461 (9) 4,190 3,676 921 746 3,269 2.930 Feb. 03, 2018 $ 72,714 51,125 15,140 2,225 4,224 653 (271) (59) 3,630 722 2,908 $3,281 $ 2,937 $2.914 Consolidated Statements of Operations - USD ($) shares in Millions, $ in Millions Total revenue Cost of sales Selling general and administrative expenses Depreciation and amortization (exclusive of depreciation included in cost of Operating income Net interest expense Net other income) / expense Earnings from continuing operations before income taxes Provision for income taxes Net earnings from continuing operations Discontinued operations, net of tax Net earnings Basic earnings per share Continuing operations in dollars per share) Discontinued operations (in dollars per share) Net earnings per share (in dollars per share) Diluted earnings per share Continuing operations (in dollars per share) Discontinued operations (in dollars per share) Net earnings per share (in dollars per share) Weighted average common shares outstanding Basic (in shares) Diluted (in shares) Antidilutive shares in shares) Sales Total revenue Other revenue Total revenue $6.39 0.02 6.42 $5.54 0.01 5.55 $5.32 0.01 5.32 5.50 6.34 0.02 $ 6.36 0.01 5.29 0.01 $5.29 $5.51 510.9 515.6 528.6 533.2 546.8 550.3 $77,130 $ 74,433 $ 71,786 $ 982 $ 923 $ 928 Page 7 of 10 Feb. 01, 2020 Feb. 02, 2019 $ 2,577 8,992 1,333 12,902 $ 1,556 9,497 1,466 12,519 Consolidated Statements of Financial Position - USD ($) Sin Millions Assets Cash and cash equivalents Inventory Other current assets Total current assets Property and equipment Land Buildings and improvements Fixtures and equipment Computer hardware and software Construction-in-progress Accumulated depreciation Property and equipment, net Operating lease assets Other noncurrent assets Total assets Liabilities and shareholders' investment Accounts payable Accrued and other current liabilities Current portion of long-term debt and other borrowings Total current liabilities Long-term debt and other borrowings Noncurrent operating lease liabilities Deferred income taxes Other noncurrent liabilities Total noncurrent liabilities Shareholders' investment Common stock Additional paid in capital Retained earnings Accumulated other comprehensive loss Total shareholders' investment Total liabilities and shareholders'investment 6,036 30,603 6,083 2,692 533 (19,664) 26,283 2,236 1,358 42,779 6,064 29,240 5,912 2,544 460 (18,687) 25,533 1,965 1,273 41,290 9,920 4,406 161 14,487 11,338 2,275 1,122 1,724 16,459 9,761 4,201 1,052 15,014 10,223 2,004 972 1,780 14,979 42 6,226 6,433 (868) 11.833 $ 42,779 43 6,042 6,017 (805) 11,297 $ 41,290 Page 8 of 10 12 Months Ended Feb. 01, 2020 Feb. 02, 2019 Feb. 03, 2018 $3,281 $ 2.937 $ 2,914 3,269 2.930 2.908 Consolidated Statements of Cash Flows - USD (S) Sin Millions Operating activities Net earnings Earnings from discontinued operations, net of tax Net earnings from continuing operations Adjustments to reconcile net earnings to cash provided by operations: Depreciation and amortization Share-based compensation expense Deferred income taxes Loss on debt extinguishment Noncash losses / trains) and other net Changes in operating accounts: 2,604 147 178 2.474 132 322 2,476 112 (188) 123 95 208 SOS (900) (299) 1,127 (348) (156) 1,307 140 199 7.099 419 5,970 6.861 74 7.117 5,973 6,935 (3,027) (3,516) (2.533) 15 (518) (55) (3,075) (2.944) (3,416) Other assets Accounts payable Accrued and other liabilities Cash provided by operating activities-continuing operations Cash provided by operating activities-discontinued operations Cash provided by operations Investing activities Expenditures for property and equipment Proceeds from disposal of property and equipment Cash paid for acquisitions, net of cash assumed Other investments Cash required for investing activities Financing activities Additions to long-term debt Reductions of long-term debt Dividends paid Repurchase of stock Stock option exercises Cash required for financing activities Net (decrease) /increase in cash and cash equivalents Cash and cash equivalents at beginning of period Cash and cash equivalents at end of period Supplemental information Interest paid, net of capitalized interest Income taxes paid Leased assets obtained in exchange for new finance lease liabilities Leased assets obtained in exchange for new operating lease liabilities 1,739 (2,069) (1,330) (1,565) (281) (1,335) (2,124) 739 (2,192) (1,338) (1,046) 96 108 (3,152) 1,021 1,556 2,577 (3,644) (1,087) 2.643 1,556 (3,729) 131 2,512 2.643 492 476 696 379 678 934 139 $ 212 $ 464 130 $ 246 Page 9 of 10 Hem Selected Financial Data Selected Financial Data For the Fiscal Year 2017 2016 2015 ons, except per share data 2019 77,130 S 78,112 $ $ 74 433 5 75,356 71,786 72.714 69,414 70,271 73,717 74.414 2.930 2.900 2.666 3,321 2,937 Net Earnings Corting operations Discontinued operations Neteams Basic Earnings Per Share Corbung operations Discontinued operations Basic earings per share 4.81 0.12 0.07 532 4.73 Diluted Earnings Per Share Continue operations Discontinued operations Diluted earnings per share 4.58 0.12 Cash dividends declared per share 2.36 7. Cash and Cash Equivalents Cash equivalents include highly liquid investments with an original maturity of three months or less from the time of purchase. Cash equivalents also include amounts due from third-party financial institutions for credit and debit card transactions. These receivables typically settle in five days or less mons) 1,810 Cash and Cash Equivalents February 1, February 2 2020 2019 Cash 326 Short-term investments 789 Receivables from third-party financial institutions for credit and debit card transactions Cash and cash equivalents 2,577 5 1,556 - We have access to these funds without any significant restrictions, taxes or penalties As of February 1, 2020 and February 2, 2019, we reclassified book overdrafts of $209 million and 5242 milion respectively to Accounts Payable and $23ion and 525 million, respectively to Accrued and Other Current Lists 441 Page 10 of 10 Refer to the selected financial statements and notes on pages 7-10 4. (6 points) Calculate quality of earnings ratio for 2019, 2018 and 2017. What can you conclude from your calculations? 5. (10 points) Using inputs solely from the cash flow statement, calculate the company's FCF for 2019. 6. (6 points) Using a market cap of $48.28, and assuming a cost of equity of 11%, calculate the long term growth rate that is implied by the company's valuation. 7. (12 points) Calculate the company's EBITDA, EBITDA margin and EBITDA multiple. BJTDA - Operating income EBITDA mayin EBITDA + deprication and Revenue Amortization 2019 2018 2020 2019 2018 1658+ -4110.12224 = 4224+2225 235+ - 68341 H 64501 7015 8. (4 points) How does this multiple compare to the industry average? Quantify your answer. (You have to make an educated guess at this company's industry) Page 4 of 10 9. (6 points) Refer to Item 6 Selected Financial Data Calculate the dividend payout ratio for the last 5 years. 10. (2 points) Calculate the current dividend yield based on a stock price of $96. 11. (3 points) Calculate the Company's PE. Price per sharo PE Earnings Per share 12. (6 points) Calculate the gross margin for the past 3 years. Page 5 of 10 13. (8 points) Fill in the (8) blanks below. (Excerpted from latest MD&A) Liquidity and Capital Resources Our period-end cash and cash equivalents balance increased to $ million from million in 2018. Our cash and cash equivalents balance includes short-term investments of $ million and $ million as of February 1, 2020, and February 2, 2019, respectively. Our investment policy is designed to preserve principal and liquidity of our short- term investments. This policy allows investments in large money market funds or in highly rated direct short-term instruments that mature in 60 days or less. We also place dollar limits on our investments in individual funds or instruments Capital Allocation We follow a disciplined and balanced approach to capital allocation based on the following priorities, ranked in order of importance: first, we fully invest in opportunities to profitably grow our business, create sustainable long-term value, and maintain our current operations and assets; second, we maintain a competitive quarterly dividend and seek to grow it annually; and finally, we return any excess cash to shareholders by repurchasing shares within the limits of our credit rating goals. Operating Cash Flows Operating cash flow provided by continuing operations was $ million in 2019 compared with $ million in 2018. The 2019 operating cash flow increase was primarily driven by higher net earnings and a reduction in inventory during 2019. Operating cash flow in 2019 also benefited from increased accounts payable due to timing of import inventory purchases, which have longer payment terms, compared with 2018. Inventory Year-end inventory was _million, compared with $ _million in 2018. Inventory levels were lower as of February 1, 2020, compared with February 2, 2019, partially due to focused efforts to reduce inventory across multiple categories where we optimized on hand quantities and assortment. Additionally, elevated inventory levels in the prior year reflected intentional investments in toys merchandise. Page 6 of 10 Egon Castle Corp Statement of Cash Flows (Indirect Approach) For the year ending December 31, 2016 Cash flows from operating activities: Net income Add (deduct) noncash effects on operating income Depreciation expense Change in accounts receivable Change in inventory Change in prepaid insurance Change in accounts payable Change in accrued liabilities Change in income taxes payable Net cash provided by operating activities Cash flows from investing activities: Purchase of equipment Net cash used by investing activities Cash flows from financing activities: Proceeds from issuing stock Dividends on common Net cash provided by financing activities Net change in cash Cash balance at January 1, 2016 Cash balance at December 31, 2016 Page 3 of 10