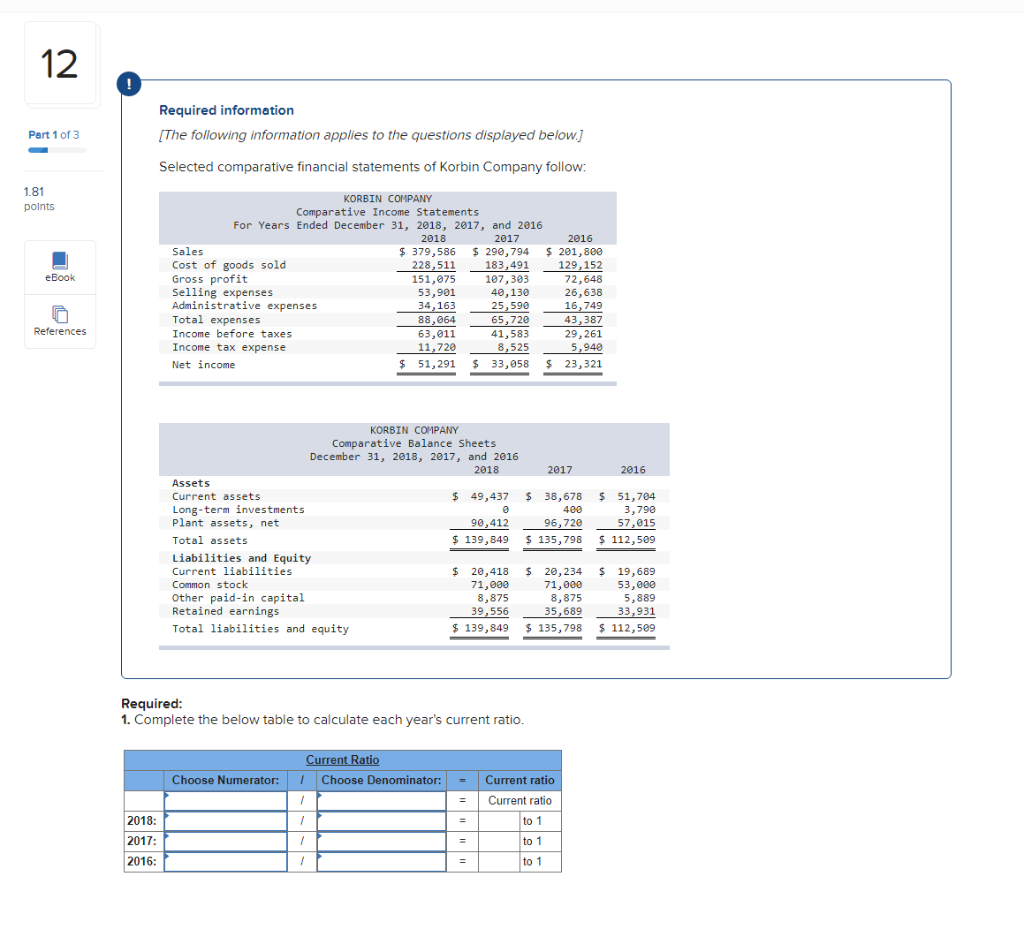
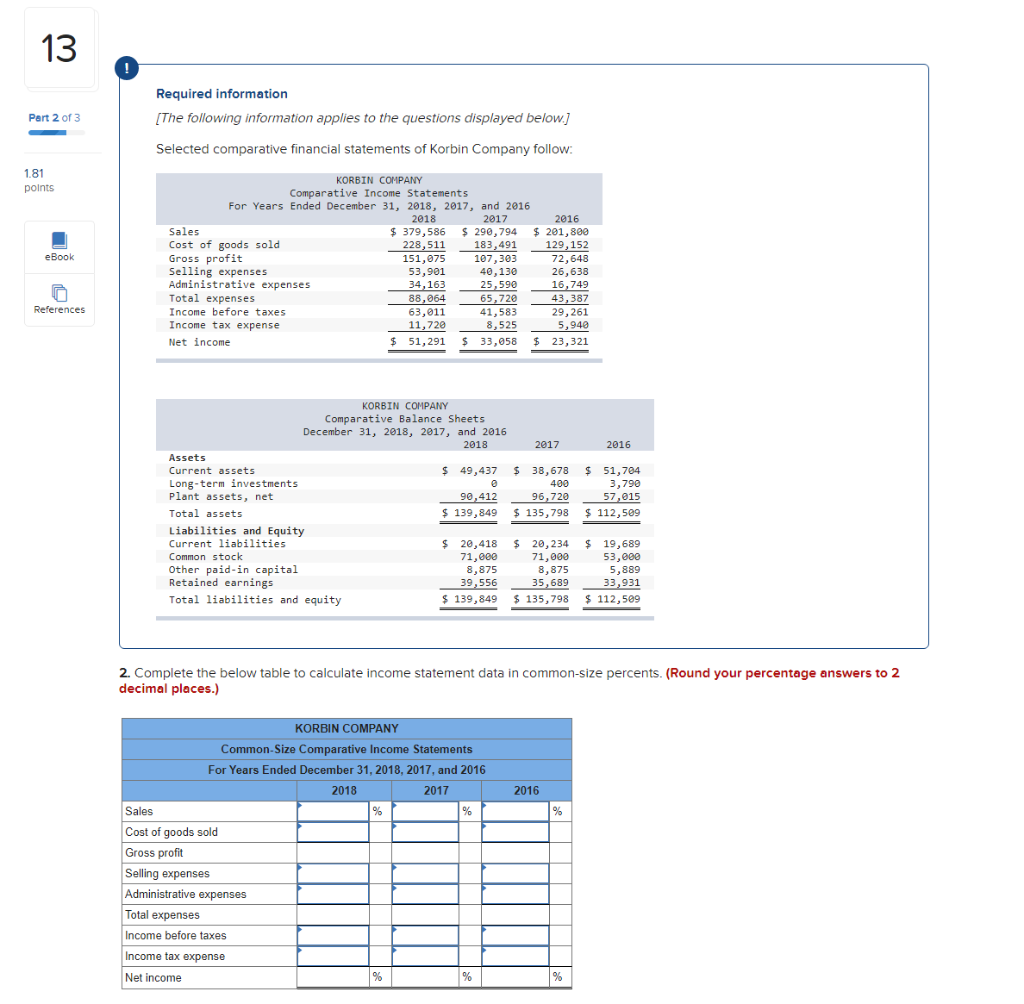
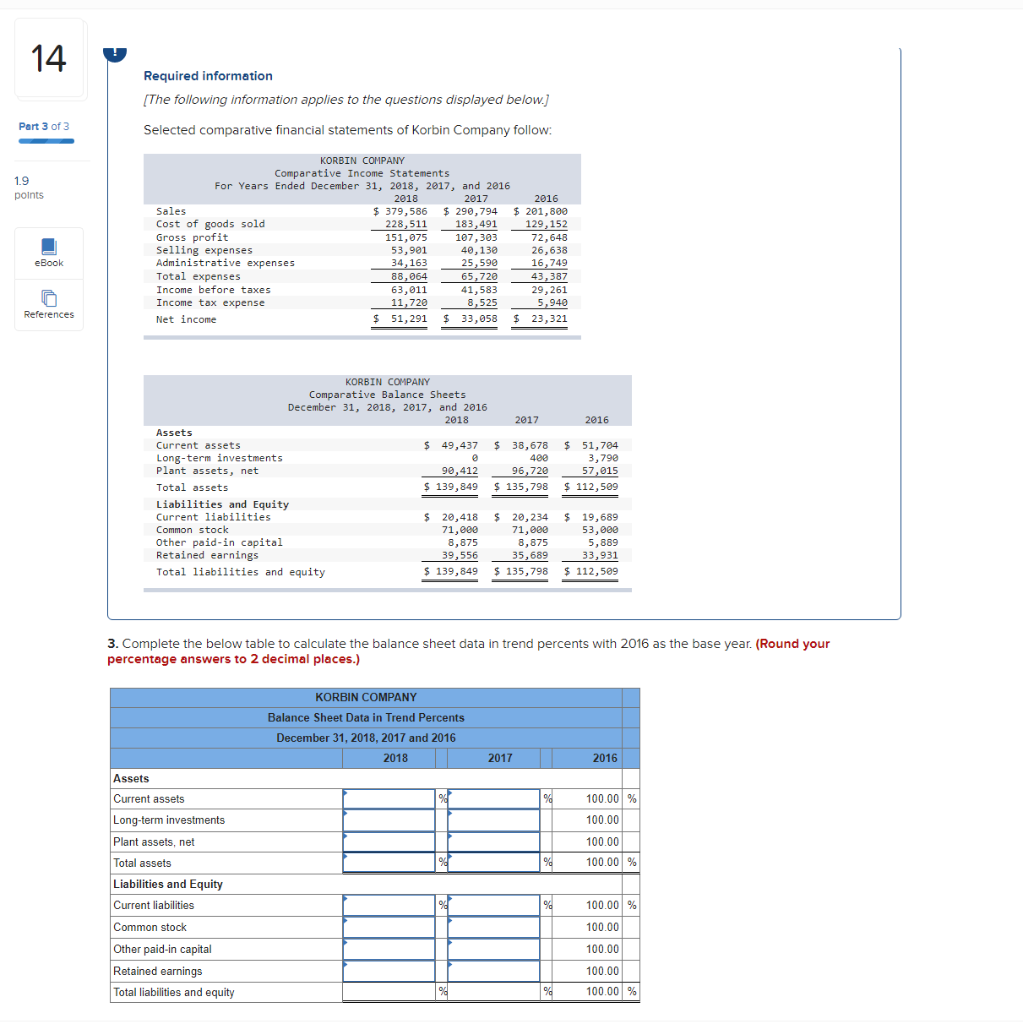
12 Required information [The following information applies to the questions displayed below.] Part 1 of 3 Selected comparative financial statements of Korbin Company follow: 1.81 points eBook KORBIN COMPANY Comparative Income Statements For Years Ended December 31, 2018, 2017, and 2016 2018 2017 2016 Sales $ 379,586 $ 290,794 $ 201,800 Cost of goods sold 228,511 183,491 129,152 Gross profit 151,075 107,303 72,648 Selling expenses 53,901 40,130 26,638 Administrative expenses 34,163 25,590 16,749 Total expenses 88,064 65,720 43,387 Income before taxes 63,011 41,583 29,261 Income tax expense 11,720 8,525 5,940 Net income $ 51,291 $ 33,058 $ 23,321 References 2017 2016 $ 51,704 3,790 KORBIN COMPANY Comparative Balance Sheets December 31, 2018, 2017, and 2016 2018 Assets Current assets $ 49,437 Long-term investments Plant assets, net 90,412 Total assets $ 139,849 Liabilities and Equity Current liabilities $ 20,418 Common stock 71,000 Other paid-in capital 8,875 Retained earnings 39,556 Total liabilities and equity $ 139,849 $ 38,678 400 96,720 $ 135,798 57,015 $ 112,509 $ 20,234 71,000 8,875 35,689 $ 135,798 $ 19,689 53,000 5,889 33,931 $ 112,509 Required: 1. Complete the below table to calculate each year's current ratio. Choose Numerator: Current Ratio Choose Denominator: 1 Current ratio Current ratio to 1 1 2018: 2017: 2016: 1 to 1 1 to 1 13 Required information [The following information applies to the questions displayed below.] Part 2 of 3 Selected comparative financial statements of Korbin Company follow: 1.81 points eBook KORBIN COMPANY Comparative Income Statements For Years Ended December 31, 2018, 2017, and 2016 2018 2017 2016 Sales $ 379,586 $ 290,794 $ 201,880 Cost of goods sold 228,511 183,491 129,152 Gross profit 151, 075 107,303 72,648 Selling expenses 53,901 40,130 26,638 Administrative expenses 34,163 25,590 16,749 Total expenses 88,064 65,720 43,387 Income before taxes 63,011 41,583 29,261 Income tax expense 11,720 8,525 5,940 Net income $ 51,291 $ 33,058 $ 23,321 References 2017 2016 KORBIN COMPANY Comparative Balance Sheets December 31, 2018, 2017, and 2016 2018 Assets Current assets $ 49,437 Long-term investments Plant assets, net 90,412 Total assets $ 139,849 Liabilities and Equity Current liabilities $ 20,418 Common stock 71,000 Other paid-in capital 8,875 Retained earnings 39,556 Total liabilities and equity $ 139,849 $ 38,678 400 96,720 $ 135,798 $ 51,704 3,790 57,015 $ 112,509 $ 20,234 71,000 8,875 35,689 $ 135,798 $ 19,689 53,000 5,889 33,931 $ 112,5e9 2. Complete the below table to calculate income statement data in common-size percents. (Round your percentage answers to 2 decimal places.) 2016 % KORBIN COMPANY Common-Size Comparative Income Statements For Years Ended December 31, 2018, 2017, and 2016 2018 2017 Sales % % Cost of goods sold Gross profit Selling expenses Administrative expenses Total expenses Income before taxes Income tax expense Net income % % % 14 u Required information (The following information applies to the questions displayed below.] Part 3 of 3 Selected comparative financial statements of Korbin Company follow: 1.9 points KORBIN COMPANY Comparative Income Statements For Years Ended December 31, 2018, 2017, and 2016 2018 2017 2016 Sales $ 379,586 $ 290,794 $ 201,800 Cost of goods sold 228,511 183,491 129,152 Gross profit 151, 075 107,303 72,648 Selling expenses 53,901 40,130 26,638 Administrative expenses 34,163 25,590 16,749 Total expenses 88,064 65,720 43,387 Income before taxes 63,011 41,583 29,261 Income tax expense 11,720 8,525 5,940 Net income $ 51,291 $ 33,058 $ 23,321 eBook References KORBIN COMPANY Comparative Balance Sheets December 31, 2018, 2017, and 2016 2018 2017 2016 Assets Current assets $ 49,437 $ 38,678 $ 51,704 Long-term investments 400 3,790 Plant assets, net 90,412 96,720 57,015 Total assets $ 139,849 $ 135,798 $ 112,509 Liabilities and Equity Current liabilities $ 20,418 $ 20,234 $ 19,689 Common stock 71,000 71,000 53,000 Other paid-in capital 8,875 8,875 5,889 Retained earnings 39,556 35,689 33,931 Total liabilities and equity $ 139,849 $ 135,798 $ 112,589 3. Complete the below table to calculate the balance sheet data in trend percents with 2016 as the base year. (Round your percentage answers to 2 decimal places.) KORBIN COMPANY Balance Sheet Data in Trend Percents December 31, 2018, 2017 and 2016 2018 2017 2016 100,00 % 100.00 100.00 % 100.00 % Assets Current assets Long-term investments Plant assets, net Total assets Liabilities and Equity Current liabilities Common stock Other paid-in capital Retained earnings Total liabilities and equity % 100.00 % 100.00 100.00 100.00 100,00 % 9