Answered step by step
Verified Expert Solution
Question
1 Approved Answer
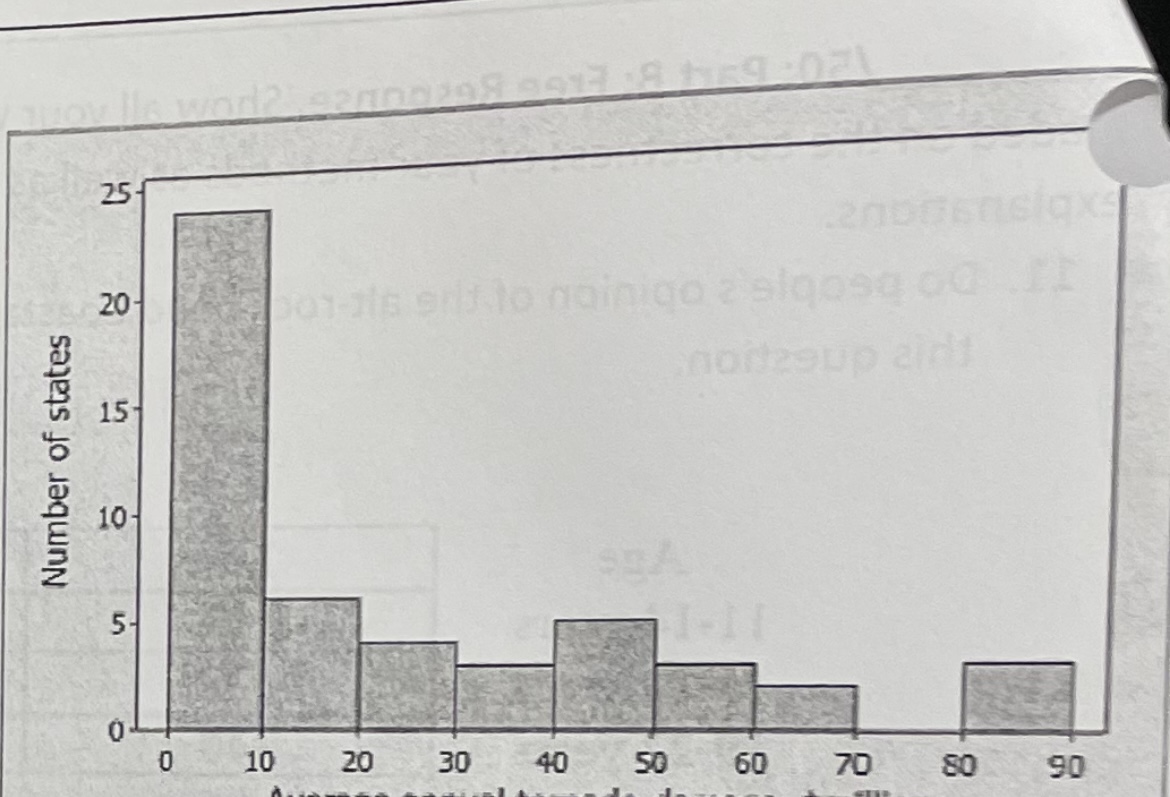
12. The states differ greatly in the kinds of severe weather that afflict them. The histogram below shows the distribution of average annual property damage
12. The states differ greatly in the kinds of severe weather that afflict them. The histogram below shows the distribution of average annual property damage caused by tornadoes over the period from 1950 to 1999 in the 50 United States. (To adjust for the changing buying power of the dollar over time, all damages were restated in 1999 dollars.)
a. (15) Describe the distribution.


Step by Step Solution
There are 3 Steps involved in it
Step: 1

Get Instant Access to Expert-Tailored Solutions
See step-by-step solutions with expert insights and AI powered tools for academic success
Step: 2

Step: 3

Ace Your Homework with AI
Get the answers you need in no time with our AI-driven, step-by-step assistance
Get Started


