

Answered step by step
Verified Expert Solution
Question
1 Approved Answer
12. When were T-bill rates at their highest over the period from 1926 through 2020? Why do you think they were so high during this
12. When were T-bill rates at their highest over the period from 1926 through 2020? Why do you think they were so high during this period? What relationship underlies your answer?
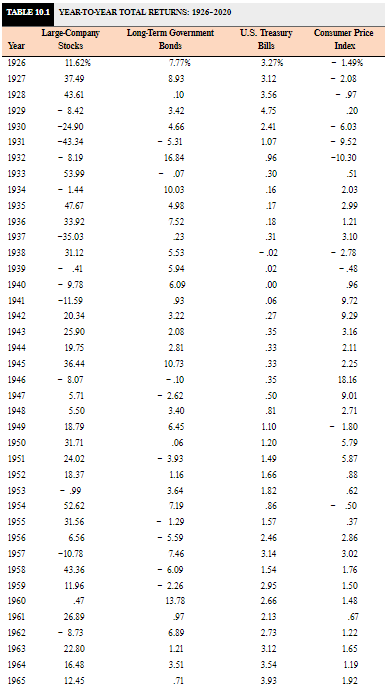
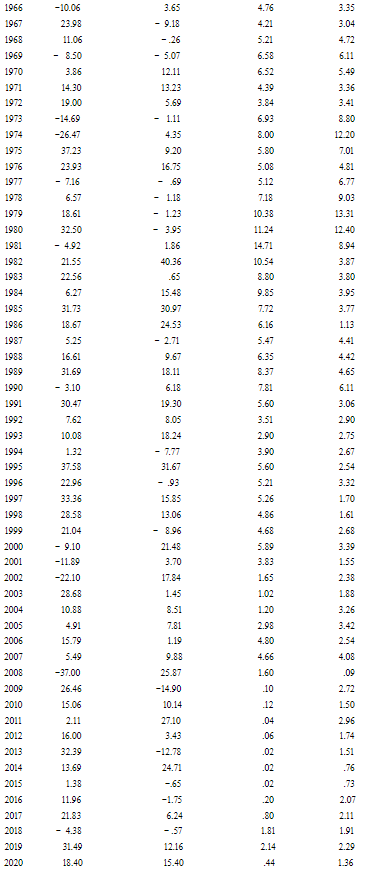
 \begin{tabular}{|c|c|c|c|c|} \hline 1966 & -10.06 & 3.65 & 4.76 & 3.35 \\ \hline 1967 & 23.98 & -9.18 & 4.21 & 3.04 \\ \hline 1968 & 11.06 & -.26 & 5.21 & 4.72 \\ \hline 1969 & -8.50 & -5.07 & 6.58 & 6.11 \\ \hline 1970 & 3.86 & 12.11 & 6.52 & 5.49 \\ \hline 1971 & 14.30 & 13.23 & 4.39 & 3.36 \\ \hline 1972 & 19.00 & 5.69 & 3.84 & 3.41 \\ \hline 1973 & -14.69 & -1.11 & 6.93 & 8.80 \\ \hline 1974 & -26.47 & 4.35 & 8.00 & 12.20 \\ \hline 1975 & 37.23 & 9.20 & 5.80 & 7.01 \\ \hline 1976 & 23.93 & 16.75 & 5.08 & 4.81 \\ \hline 1977 & -7.16 & -.69 & 5.12 & 6.77 \\ \hline 1978 & 6.57 & -1.18 & 7.18 & 9.03 \\ \hline 1979 & 18.61 & -1.23 & 10.38 & 13.31 \\ \hline 1980 & 32.50 & -3.95 & 11.24 & 12.40 \\ \hline 1981 & -4.92 & 1.86 & 14.71 & 8.94 \\ \hline 1982 & 21.55 & 40.36 & 10.54 & 3.87 \\ \hline 1983 & 22.56 & .65 & 8.80 & 3.80 \\ \hline 1984 & 6.27 & 15.48 & 9.85 & 3.95 \\ \hline 1985 & 31.73 & 30.97 & 7.72 & 3.77 \\ \hline 1986 & 18.67 & 24.53 & 6.16 & 1.13 \\ \hline 1987 & 5.25 & -2.71 & 5.47 & 4.41 \\ \hline 1988 & 16.61 & 9.67 & 6.35 & 4.42 \\ \hline 1989 & 31.69 & 18.11 & 8.37 & 4.65 \\ \hline 1990 & -3.10 & 6.18 & 7.81 & 6.11 \\ \hline 1991 & 30.47 & 19.30 & 5.60 & 3.06 \\ \hline 1992 & 7.62 & 8.05 & 3.51 & 2.90 \\ \hline 1993 & 10.08 & 18.24 & 2.90 & 2.75 \\ \hline 1994 & 1.32 & -7.77 & 3.90 & 2.67 \\ \hline 1995 & 37.58 & 31.67 & 5.60 & 2.54 \\ \hline 1996 & 22.96 & -.93 & 5.21 & 3.32 \\ \hline 1997 & 33.36 & 15.85 & 5.26 & 1.70 \\ \hline 1998 & 28.58 & 13.06 & 4.86 & 1.61 \\ \hline 1999 & 21.04 & -8.96 & 4.68 & 2.68 \\ \hline 2000 & -9.10 & 21.48 & 5.89 & 3.39 \\ \hline 2001 & -11.89 & 3.70 & 3.83 & 1.55 \\ \hline 2002 & -22.10 & 17.84 & 1.65 & 2.38 \\ \hline 2003 & 28.68 & 1.45 & 1.02 & 1.88 \\ \hline 2004 & 10.88 & 8.51 & 1.20 & 3.26 \\ \hline 2005 & 4.91 & 7.81 & 2.98 & 3.42 \\ \hline 2006 & 15.79 & 1.19 & 4.80 & 2.54 \\ \hline 2007 & 5.49 & 9.88 & 4.66 & 4.08 \\ \hline 2008 & -37.00 & 25.87 & 1.60 & .09 \\ \hline 2009 & 26.46 & -14.90 & .10 & 2.72 \\ \hline 2010 & 15.06 & 10.14 & .12 & 1.50 \\ \hline 2011 & 2.11 & 27.10 & .04 & 2.96 \\ \hline 2012 & 16.00 & 3.43 & .06 & 1.74 \\ \hline 2013 & 32.39 & -12.78 & .02 & 1.51 \\ \hline 2014 & 13.69 & 24.71 & .02 & .76 \\ \hline 2015 & 1.38 & -.65 & .02 & .73 \\ \hline 2016 & 11.96 & -1.75 & .20 & 2.07 \\ \hline 2017 & 21.83 & 6.24 & .80 & 2.11 \\ \hline 2018 & -4.38 & -.57 & 1.81 & 1.91 \\ \hline 2019 & 31.49 & 12.16 & 2.14 & 2.29 \\ \hline 2020 & 18.40 & 15.40 & .44 & 1.36 \\ \hline \end{tabular} Figure 10.7 Year-to-year total returns on bonds and bills: 19262020
 Step by Step Solution
There are 3 Steps involved in it
Step: 1

Get Instant Access to Expert-Tailored Solutions
See step-by-step solutions with expert insights and AI powered tools for academic success
Step: 2

Step: 3
Ace Your Homework with AI
Get the answers you need in no time with our AI-driven, step-by-step assistance
Get Started
Theory Of Constraints Handbook
Authors: James Cox, John Schleier
1st Edition
0071665544, 978-0071665544