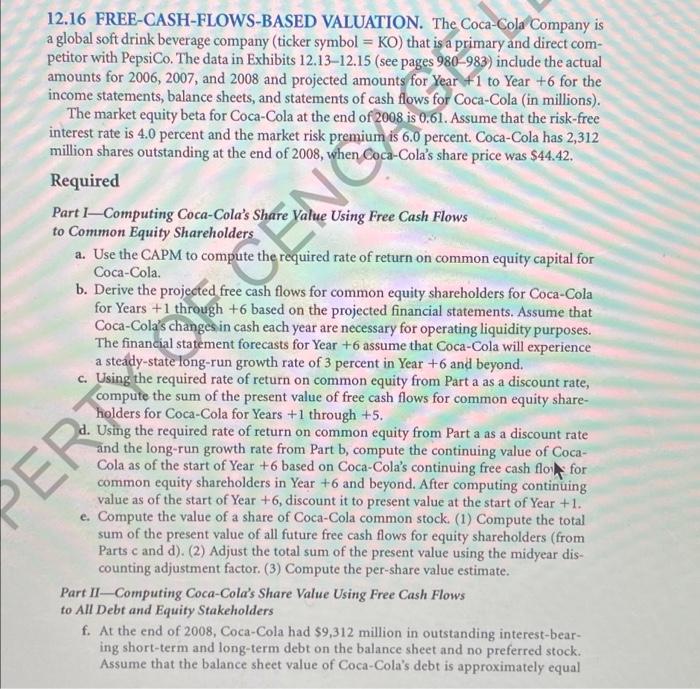
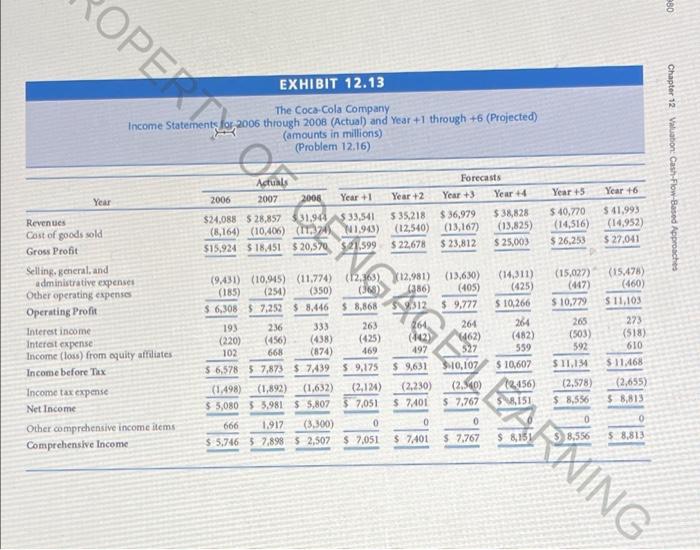
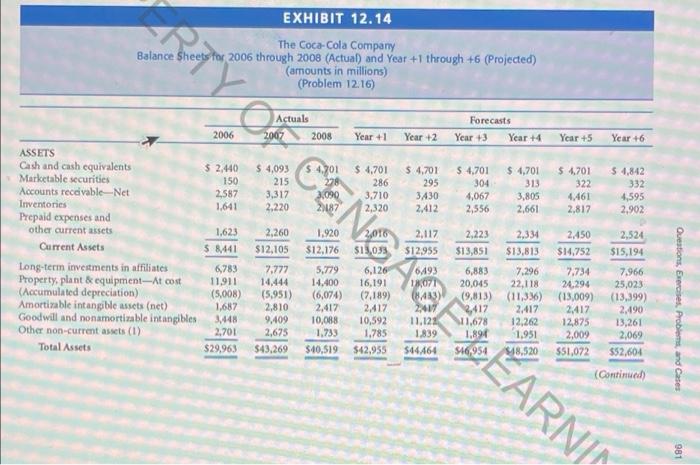
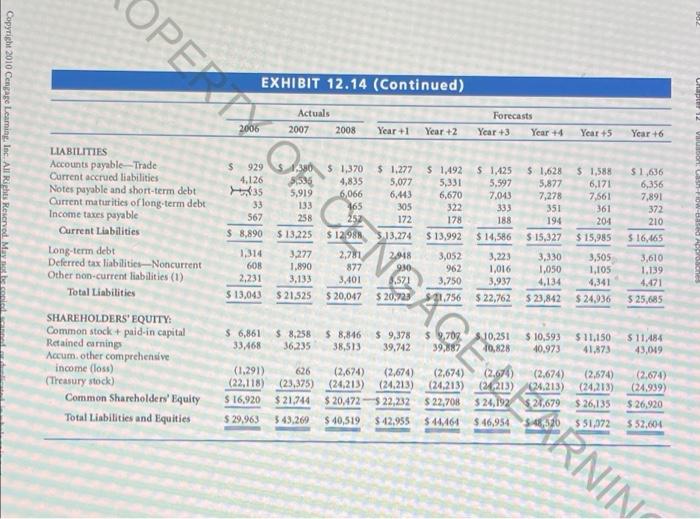
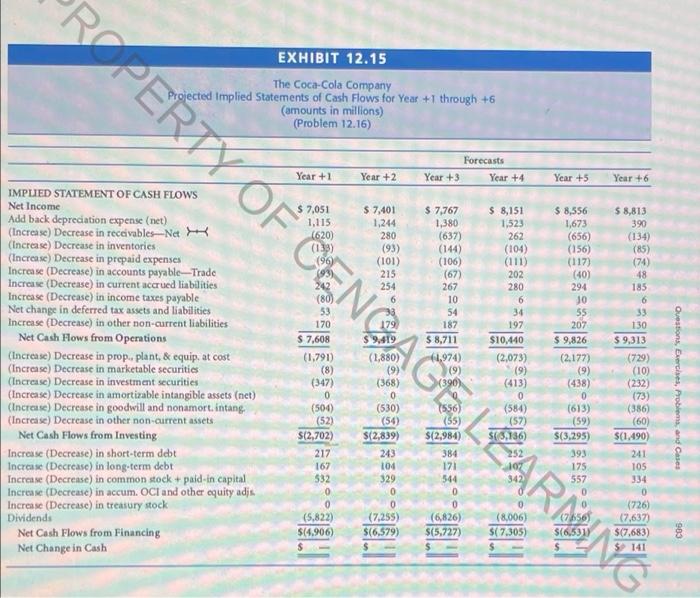
12.16 FREE-CASH-FLOWS-BASED VALUATION. The Coca-Cola Company is a global soft drink beverage company (ticker symbol = KO) that is a primary and direct com- petitor with PepsiCo. The data in Exhibits 12.13-12.15 (see pages 980983) include the actual amounts for 2006, 2007, and 2008 and projected amounts for Year + 1 to Year +6 for the income statements, balance sheets, and statements of cash flows for Coca-Cola (in millions). The market equity beta for Coca-Cola at the end of 2008 is 0.61. Assume that the risk-free interest rate is 4.0 percent and the market risk premium is 6.0 percent. Coca-Cola has 2,312 million shares outstanding at the end of 2008, when Coca-Cola's share price was $44.42. Required Part 1-Computing Coca-Cola's Share Value Using Free Cash Flows to Common Equity Shareholders a. Use the CAPM to compute the required rate of return on common equity capital for Coca-Cola b. Derive the projected free cash flows for common equity shareholders for Coca-Cola for Years +1 through +6 based on the projected financial statements. Assume that Coca-Cola's changes in cash each year are necessary for operating liquidity purposes. The financial statement forecasts for Year +6 assume that Coca-Cola will experience a steady-state long-run growth rate of 3 percent in Year +6 and beyond. c. Using the required rate of return on common equity from Part a as a discount rate, compute the sum of the present value of free cash flows for common equity share- holders for Coca-Cola for Years +1 through +5. d. Using the required rate of return on common equity from Part a as a discount rate and the long-run growth rate from Part b, compute the continuing value of Coca- Cola as of the start of Year +6 based on Coca-Cola's continuing free cash flow for common equity shareholders in Year +6 and beyond. After computing continuing value as of the start of Year +6, discount it to present value at the start of Year +1. e. Compute the value of a share of Coca-Cola common stock. (1) Compute the total sum of the present value of all future free cash flows for equity shareholders (from Parts c and d). (2) Adjust the total sum of the present value using the midyear dis- counting adjustment factor. (3) Compute the per-share value estimate. Part IIComputing Coca-Cola's Share Value Using Free Cash Flows to All Debt and Equity Stakeholders f. At the end of 2008, Coca-Cola had $9,312 million in outstanding interest-bear- ing short-term and long-term debt on the balance sheet and no preferred stock. Assume that the balance sheet value of Coca-Cola's debt is approximately equal SENG PERI EXHIBIT 12.14 The Coca-Cola Company Balance Sheets for 2006 through 2008 (Actual) and Year +1 through +6 (Projected) (amounts in millions) (Problem 12.16) O Actuals 2007 2008 2006 Year +1 Forecasts Year +3 Year +4 Year +2 Year +5 Year +6 $ 4,093 $ 2.40 150 2,587 1.641 215 3,317 2,220 $ 4701 278 3.090 2187 $ 4,701 286 3.710 2,320 $ 4,701 322 4.461 2,817 $ 4,842 332 4,595 2,902 ASSETS Cash and cash equivalents Marketable securities Accounts receivable-Net Inventories Prepaid expenses and other current assets Current Assets Long-term investments in affiliates Property, plant & equipment-At cost (Accumulated depreciation) Amortizable intangible assets (net) Goodwill and nonamortizable intangibles Other non-current assets (1) Total Assets 1.623 5 8441 6789 11911 (5.008) 1,687 3448 2,701 $29,963 2,260 $12,105 7,777 14,444 (5.951) 2,810 9.409 2,675 $43,269 1.920 $12,176 5,779 14,400 (6,074) 2,417 10,088 1.733 $40,519 2,016 $13,033 6,126 16.191 (7.189) 2,417 10,592 1.785 $42,955 2,524 $15,194 7.966 25,023 (13,399) 2.490 13,261 2,069 $52,604 Questions, Exercises Problems and Cases EARNI (Continued) 981 OPE EXHIBIT 12.14 (Continued) Copyright 2010 Cengage Leaming, Inc. All Rights Reserved. Men Actuals 2007 2008 Forecasts Year +3 Year 14 Year +1 Year +2 Year +5 Year +6 $ 1,492 5,331 6,670 s 929 4.126 35 33 567 $ 8,890 $ 1,425 5,597 7,013 $ 1.628 5.877 7,278 351 322 333 $ 1,588 6,171 7.561 361 204 $ 15,985 188 30 $ 1,370 $ 1.277 3,536 4,835 5,077 5,919 6,066 6,443 133 165 305 258 252 172 $ 13.225 $ 12,98 $ 13,274 3,277 2,781 2.918 1.890 877 930 3,401 5.521 $ 21.525 $20,047 $20.723 178 $ 13,992 $ 14,586 LIABILITIES Accounts payable-Trade Current accrued liabilities Notes payable and short-term debt Current maturities of long-term debt Income taxes payable Current Liabilities Long-term debt Deferred tax liabilities-Noncurrent Other non-current liabilities (1) Total Liabilities SHAREHOLDERS' EQUITY: Common stock + paid.in capital Retained camnings Accum. other comprehensive income (los) (Treasury stock) Common Shareholders' Equity Total Liabilities and Equities $1,636 6,356 7,891 372 210 $ 16,465 3,610 1.139 4.471 $ 25,685 1,314 60B 2,231 $ 13,043 3,133 3,052 3,223 962 1,016 3.750 3,937 21.756 $22,762 3,505 1,105 1,341 $ 24,936 $ 6,861 33,468 $ 8,258 36,235 $8,846 $9,378 38,513 39,742 $ 9,707 39,887 0,251 10,828 $ 11,150 41,873 $11.484 43,019 (1.291) (22,118) $ 16,920 $29.963 626 (2,674) (2,674) (23,375) (24,213) (24.213) $ 21,744 $20.472522,232 543,269 $ 40,519 $42,955 (2,674) (24,213) $ 22,708 PARNIN (2.674) (24.939 $ 26,920 $ 52,004 $44461 EXHIBIT 12.15 The Coca-Cola Company Projected Implied Statements of Cash Flows for Year +T through +6 (amounts in millions) (Problem 12.16) Forecasts Year +3 Year +4 Year +1 Year +2 Year +5 Year +6 $ 8,813 390 $ 7,767 1,380 (637) (144) (106) $ 8,151 1523 262 (104) (111) 202 280 6 34 $ 8,556 1,673 (656) (156) (117) (40) 294 JO 55 207 $ 9,826 (2.177 IMPLIED STATEMENT OF CASH FLOWS Net Income Add back depreciation expense (net) (Increase) Decrease in receivables-Net (Increase) Decrease in inventories (Increase) Decrease in prepaid expenses Increase (Decrease) in accounts payable-Trade Increase (Decrease) in current accrued liabilities Increase (Decrease) in income taxes payable Net change in deferred tax assets and liabilities Increase (Decrease) in other non-current liabilities Net Cash Hows from Operations (Increase) Decrease in prop, plant, & equip, at cost (Increase) Decrease in marketable securities (Increase) Decrease in investment securities (Increase) Decrease in amortizable intangible assets (net) (Increase) Decrease in goodwill and nonamort.intang (Increase) Decrease in other non-current assets Net Cash Flows from Investing Increase (Decrease) in short-term det Increase (Decrease) in long-term debt Increase (Decrease) in common stock + paid-in capital Increase (Decrease) in accum. OCl and other equity adin. Increase (Decrease) in treasury stock Dividends Net Cash Flows from Financing Net Change in Cash P PERTY OF CENGAGE LZARNI (134) (85) (74) 48 185 6 33 130 $ 9,313 (729) (10) (232) (73) (386 (60) $(1.490) 241 105 334 0 (726) (7,637) Questions, Exercises Problems and Cases 0 (6,826) $(5,727) C06 N 12.16 FREE-CASH-FLOWS-BASED VALUATION. The Coca-Cola Company is a global soft drink beverage company (ticker symbol = KO) that is a primary and direct com- petitor with PepsiCo. The data in Exhibits 12.13-12.15 (see pages 980983) include the actual amounts for 2006, 2007, and 2008 and projected amounts for Year + 1 to Year +6 for the income statements, balance sheets, and statements of cash flows for Coca-Cola (in millions). The market equity beta for Coca-Cola at the end of 2008 is 0.61. Assume that the risk-free interest rate is 4.0 percent and the market risk premium is 6.0 percent. Coca-Cola has 2,312 million shares outstanding at the end of 2008, when Coca-Cola's share price was $44.42. Required Part 1-Computing Coca-Cola's Share Value Using Free Cash Flows to Common Equity Shareholders a. Use the CAPM to compute the required rate of return on common equity capital for Coca-Cola b. Derive the projected free cash flows for common equity shareholders for Coca-Cola for Years +1 through +6 based on the projected financial statements. Assume that Coca-Cola's changes in cash each year are necessary for operating liquidity purposes. The financial statement forecasts for Year +6 assume that Coca-Cola will experience a steady-state long-run growth rate of 3 percent in Year +6 and beyond. c. Using the required rate of return on common equity from Part a as a discount rate, compute the sum of the present value of free cash flows for common equity share- holders for Coca-Cola for Years +1 through +5. d. Using the required rate of return on common equity from Part a as a discount rate and the long-run growth rate from Part b, compute the continuing value of Coca- Cola as of the start of Year +6 based on Coca-Cola's continuing free cash flow for common equity shareholders in Year +6 and beyond. After computing continuing value as of the start of Year +6, discount it to present value at the start of Year +1. e. Compute the value of a share of Coca-Cola common stock. (1) Compute the total sum of the present value of all future free cash flows for equity shareholders (from Parts c and d). (2) Adjust the total sum of the present value using the midyear dis- counting adjustment factor. (3) Compute the per-share value estimate. Part IIComputing Coca-Cola's Share Value Using Free Cash Flows to All Debt and Equity Stakeholders f. At the end of 2008, Coca-Cola had $9,312 million in outstanding interest-bear- ing short-term and long-term debt on the balance sheet and no preferred stock. Assume that the balance sheet value of Coca-Cola's debt is approximately equal SENG PERI EXHIBIT 12.14 The Coca-Cola Company Balance Sheets for 2006 through 2008 (Actual) and Year +1 through +6 (Projected) (amounts in millions) (Problem 12.16) O Actuals 2007 2008 2006 Year +1 Forecasts Year +3 Year +4 Year +2 Year +5 Year +6 $ 4,093 $ 2.40 150 2,587 1.641 215 3,317 2,220 $ 4701 278 3.090 2187 $ 4,701 286 3.710 2,320 $ 4,701 322 4.461 2,817 $ 4,842 332 4,595 2,902 ASSETS Cash and cash equivalents Marketable securities Accounts receivable-Net Inventories Prepaid expenses and other current assets Current Assets Long-term investments in affiliates Property, plant & equipment-At cost (Accumulated depreciation) Amortizable intangible assets (net) Goodwill and nonamortizable intangibles Other non-current assets (1) Total Assets 1.623 5 8441 6789 11911 (5.008) 1,687 3448 2,701 $29,963 2,260 $12,105 7,777 14,444 (5.951) 2,810 9.409 2,675 $43,269 1.920 $12,176 5,779 14,400 (6,074) 2,417 10,088 1.733 $40,519 2,016 $13,033 6,126 16.191 (7.189) 2,417 10,592 1.785 $42,955 2,524 $15,194 7.966 25,023 (13,399) 2.490 13,261 2,069 $52,604 Questions, Exercises Problems and Cases EARNI (Continued) 981 OPE EXHIBIT 12.14 (Continued) Copyright 2010 Cengage Leaming, Inc. All Rights Reserved. Men Actuals 2007 2008 Forecasts Year +3 Year 14 Year +1 Year +2 Year +5 Year +6 $ 1,492 5,331 6,670 s 929 4.126 35 33 567 $ 8,890 $ 1,425 5,597 7,013 $ 1.628 5.877 7,278 351 322 333 $ 1,588 6,171 7.561 361 204 $ 15,985 188 30 $ 1,370 $ 1.277 3,536 4,835 5,077 5,919 6,066 6,443 133 165 305 258 252 172 $ 13.225 $ 12,98 $ 13,274 3,277 2,781 2.918 1.890 877 930 3,401 5.521 $ 21.525 $20,047 $20.723 178 $ 13,992 $ 14,586 LIABILITIES Accounts payable-Trade Current accrued liabilities Notes payable and short-term debt Current maturities of long-term debt Income taxes payable Current Liabilities Long-term debt Deferred tax liabilities-Noncurrent Other non-current liabilities (1) Total Liabilities SHAREHOLDERS' EQUITY: Common stock + paid.in capital Retained camnings Accum. other comprehensive income (los) (Treasury stock) Common Shareholders' Equity Total Liabilities and Equities $1,636 6,356 7,891 372 210 $ 16,465 3,610 1.139 4.471 $ 25,685 1,314 60B 2,231 $ 13,043 3,133 3,052 3,223 962 1,016 3.750 3,937 21.756 $22,762 3,505 1,105 1,341 $ 24,936 $ 6,861 33,468 $ 8,258 36,235 $8,846 $9,378 38,513 39,742 $ 9,707 39,887 0,251 10,828 $ 11,150 41,873 $11.484 43,019 (1.291) (22,118) $ 16,920 $29.963 626 (2,674) (2,674) (23,375) (24,213) (24.213) $ 21,744 $20.472522,232 543,269 $ 40,519 $42,955 (2,674) (24,213) $ 22,708 PARNIN (2.674) (24.939 $ 26,920 $ 52,004 $44461 EXHIBIT 12.15 The Coca-Cola Company Projected Implied Statements of Cash Flows for Year +T through +6 (amounts in millions) (Problem 12.16) Forecasts Year +3 Year +4 Year +1 Year +2 Year +5 Year +6 $ 8,813 390 $ 7,767 1,380 (637) (144) (106) $ 8,151 1523 262 (104) (111) 202 280 6 34 $ 8,556 1,673 (656) (156) (117) (40) 294 JO 55 207 $ 9,826 (2.177 IMPLIED STATEMENT OF CASH FLOWS Net Income Add back depreciation expense (net) (Increase) Decrease in receivables-Net (Increase) Decrease in inventories (Increase) Decrease in prepaid expenses Increase (Decrease) in accounts payable-Trade Increase (Decrease) in current accrued liabilities Increase (Decrease) in income taxes payable Net change in deferred tax assets and liabilities Increase (Decrease) in other non-current liabilities Net Cash Hows from Operations (Increase) Decrease in prop, plant, & equip, at cost (Increase) Decrease in marketable securities (Increase) Decrease in investment securities (Increase) Decrease in amortizable intangible assets (net) (Increase) Decrease in goodwill and nonamort.intang (Increase) Decrease in other non-current assets Net Cash Flows from Investing Increase (Decrease) in short-term det Increase (Decrease) in long-term debt Increase (Decrease) in common stock + paid-in capital Increase (Decrease) in accum. OCl and other equity adin. Increase (Decrease) in treasury stock Dividends Net Cash Flows from Financing Net Change in Cash P PERTY OF CENGAGE LZARNI (134) (85) (74) 48 185 6 33 130 $ 9,313 (729) (10) (232) (73) (386 (60) $(1.490) 241 105 334 0 (726) (7,637) Questions, Exercises Problems and Cases 0 (6,826) $(5,727) C06 N
