

Answered step by step
Verified Expert Solution
Question
1 Approved Answer
12.2 -6 Print 6. A survey of 36 randomly selected students who dropped a course was conducted at a college. (a) Construct a contingency table
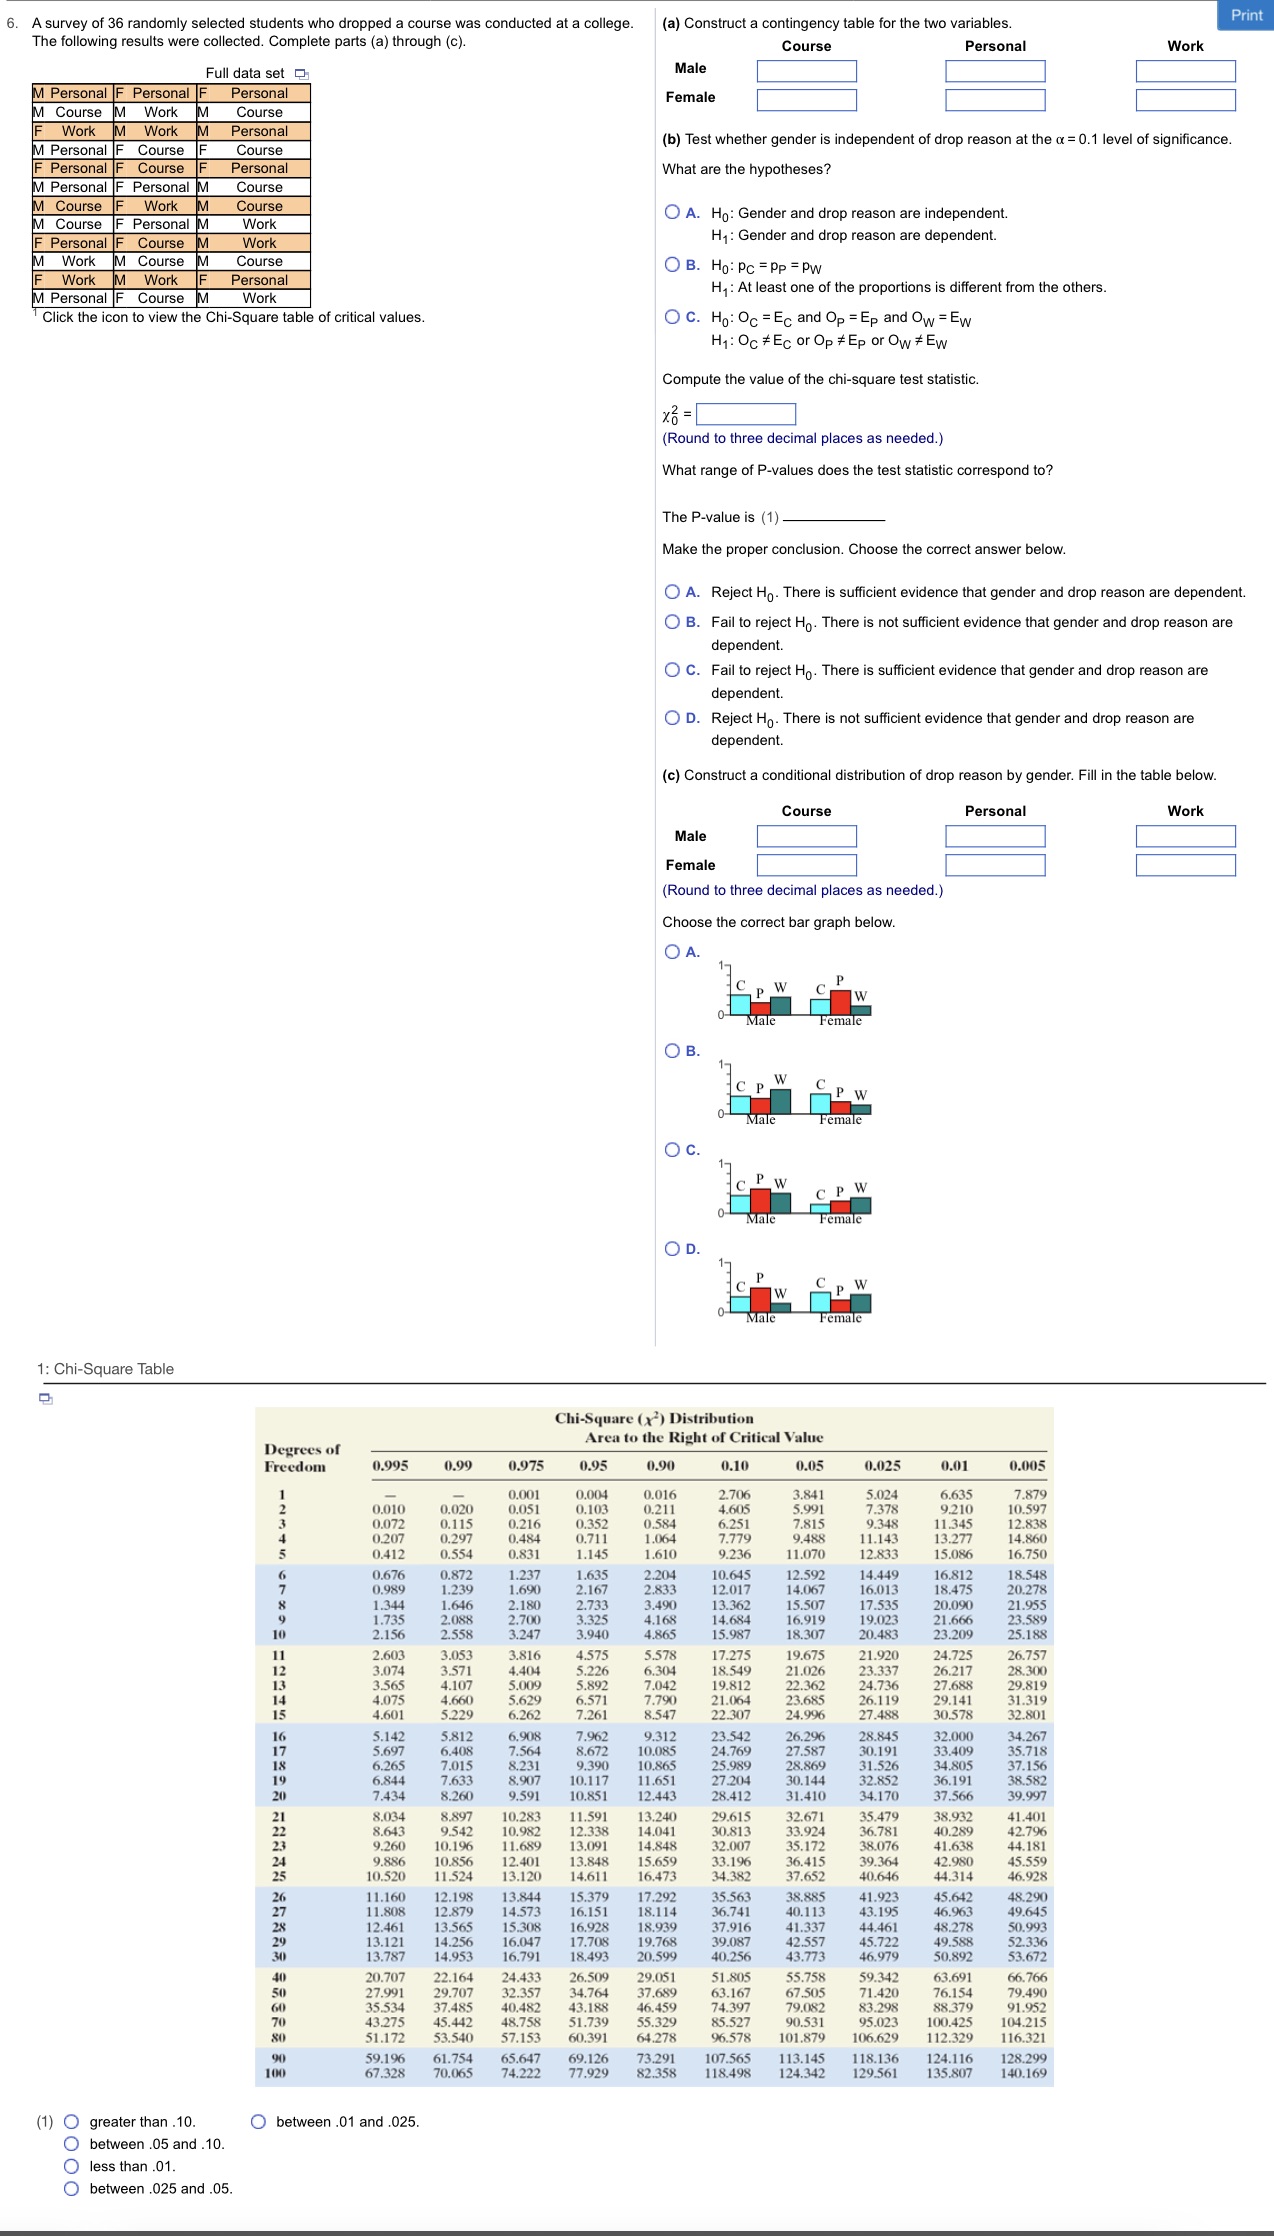
12.2 -6

Step by Step Solution
There are 3 Steps involved in it
Step: 1

Get Instant Access to Expert-Tailored Solutions
See step-by-step solutions with expert insights and AI powered tools for academic success
Step: 2

Step: 3
Ace Your Homework with AI
Get the answers you need in no time with our AI-driven, step-by-step assistance
Get Started
Statistics Informed Decisions Using Data
Authors: Michael Sullivan III
5th Edition
978-0134135373, 134133536, 134135377, 978-0134133539