Answered step by step
Verified Expert Solution
Link Copied!

Question

1 Approved Answer

12.2 Q2 Creating and Analyzing Create Scatterplots for each of the tables of data below us which of the graphs most closely matches each table.

12.2 Q2
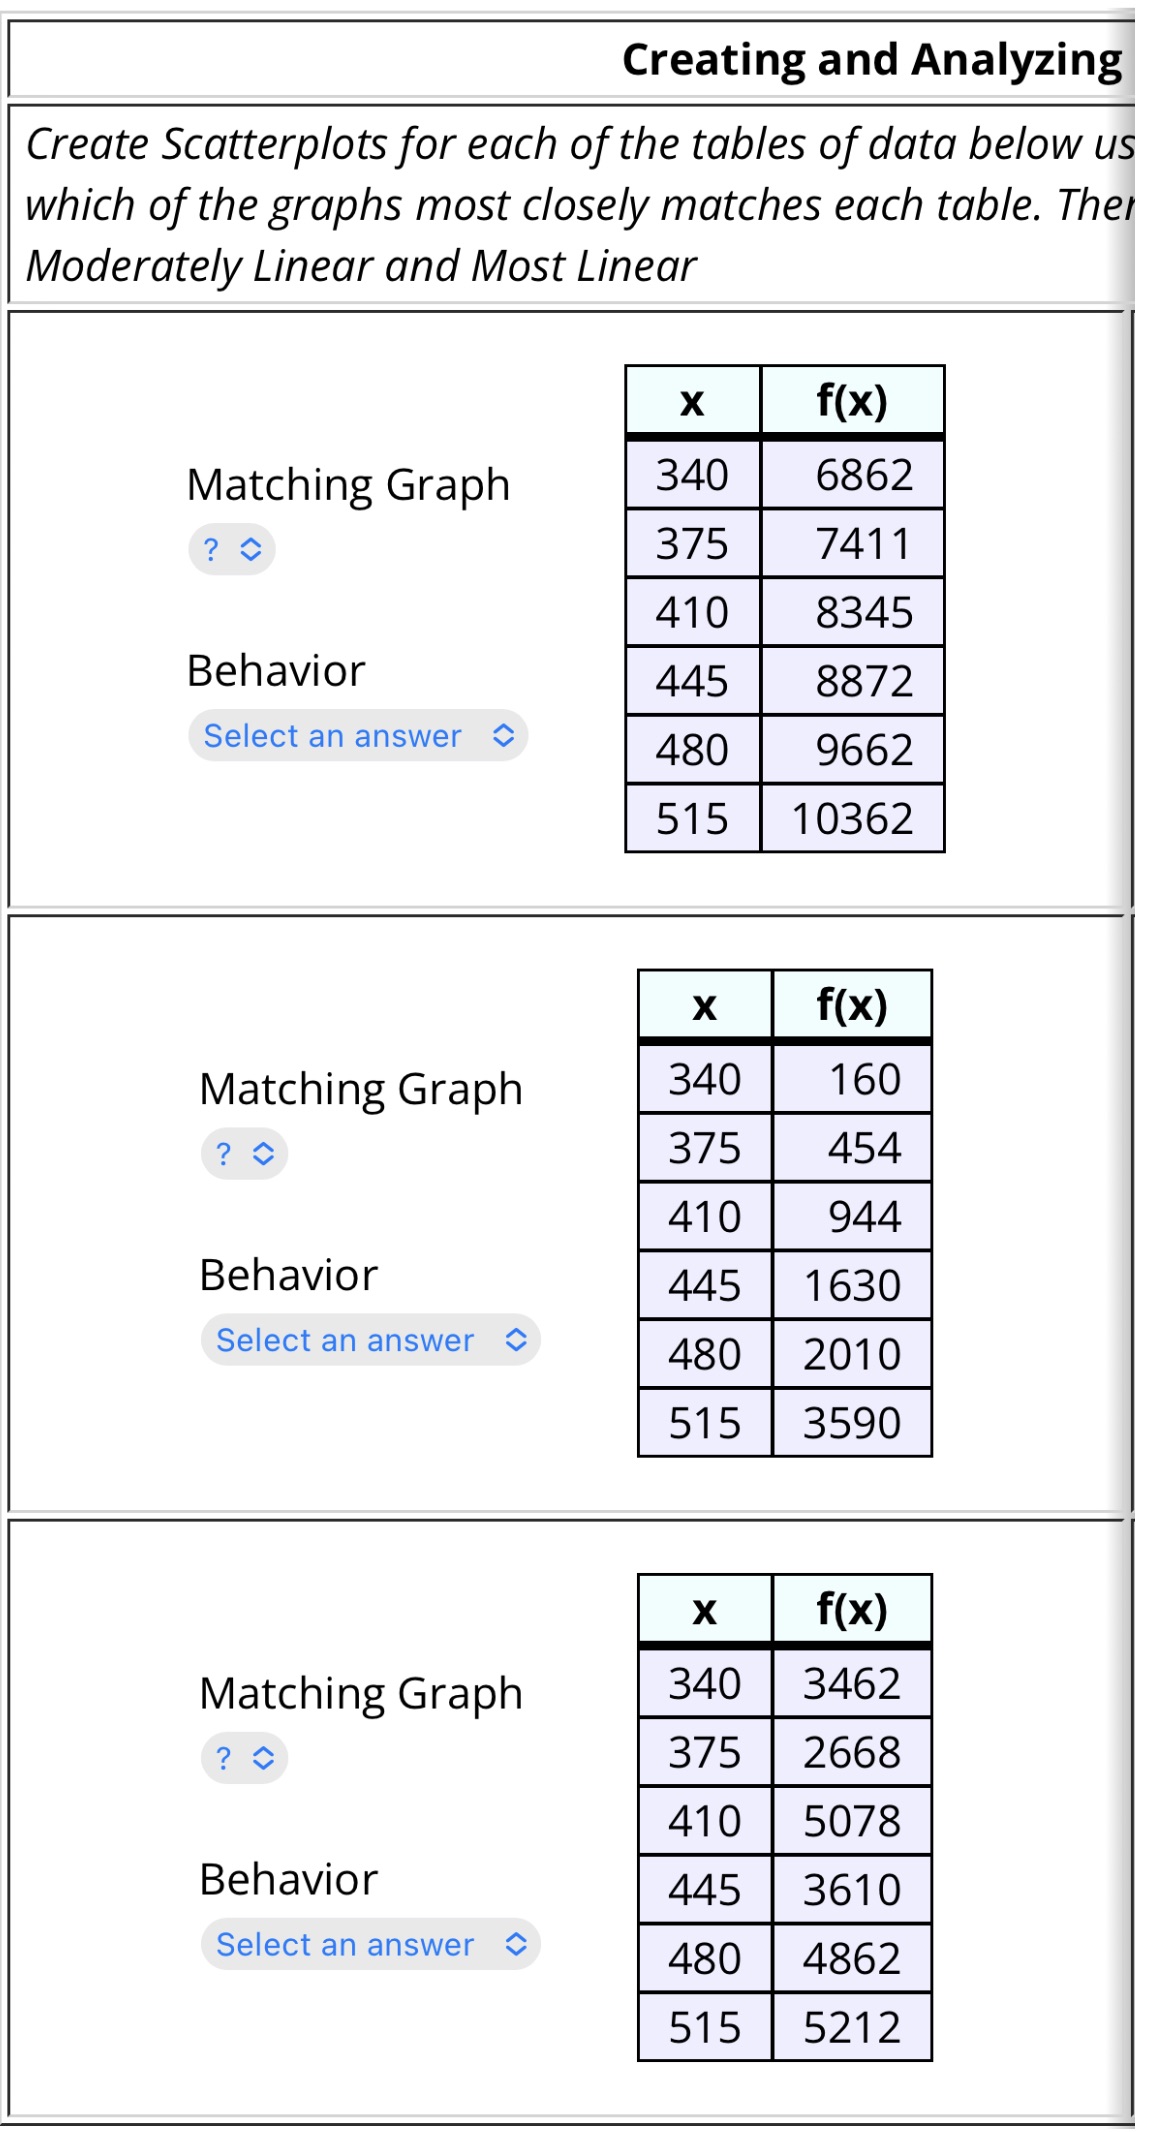
image text in transcribed
Creating and Analyzing Create Scatterplots for each of the tables of data below us which of the graphs most closely matches each table. The Moderately Linear and Most Linear X f(x) Matching Graph 340 6862 ? C 375 7411 410 8345 Behavior 445 8872 Select an answer 480 9662 515 10362 X f(X) Matching Graph 340 160 ? C 375 454 410 944 Behavior 445 1630 Select an answer C 480 2010 515 3590 X f(x) Matching Graph 340 3462 ? C 375 2668 410 5078 Behavior 445 3610 Select an answer C 480 4862 515 5212

Step by Step Solution

There are 3 Steps involved in it

Step: 1

blur-text-image

Get Instant Access to Expert-Tailored Solutions

See step-by-step solutions with expert insights and AI powered tools for academic success

Step: 2

blur-text-image

Step: 3

blur-text-image

Ace Your Homework with AI

Get the answers you need in no time with our AI-driven, step-by-step assistance

Get Started

Recommended Textbook for

Linear Algebra With Applications

Authors: W. Keith Nicholson

7th Edition

978-0070985100, 70985103

More Books

Students also viewed these Mathematics questions

Question

Find the LCM of 18,24 , and 40 using lists and prime factorization.

Answered: 1 week ago