Answered step by step
Verified Expert Solution
Question
1 Approved Answer
12.3 The following chart illustrates the UK commercial property returns between 1981 and 2010. Percent per Year Capital Income 81 85 89 93 9 7
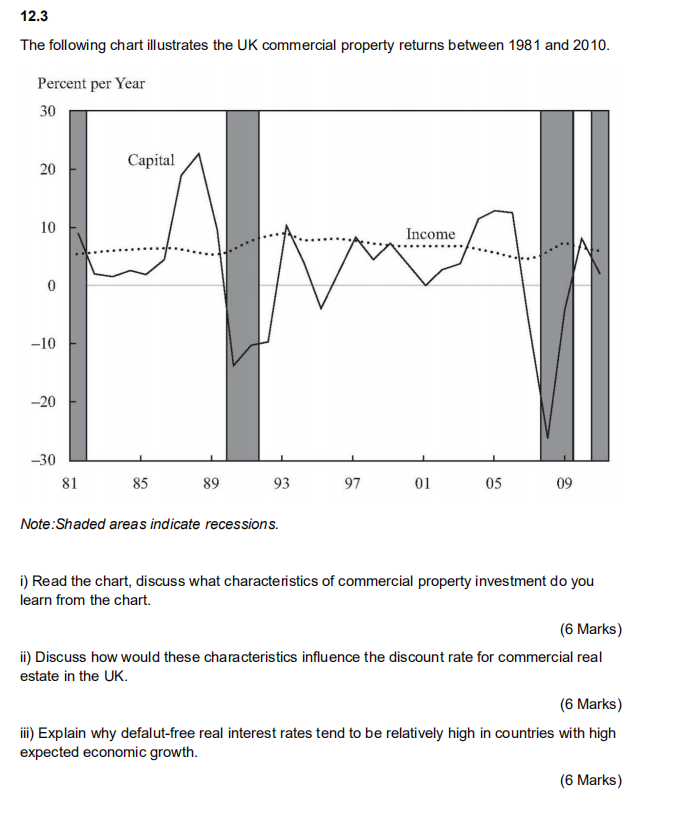
12.3 The following chart illustrates the UK commercial property returns between 1981 and 2010. Percent per Year Capital Income 81 85 89 93 9 7 01 05 09 Note:Shaded areas indicate recessions. i) Read the chart, discuss what characteristics of commercial property investment do you learn from the chart. (6 Marks) ii) Discuss how would these characteristics influence the discount rate for commercial real estate in the UK. (6 Marks) iii) Explain why defalut-free real interest rates tend to be relatively high in countries with high expected economic growth. (6 Marks) 12.3 The following chart illustrates the UK commercial property returns between 1981 and 2010. Percent per Year Capital Income 81 85 89 93 9 7 01 05 09 Note:Shaded areas indicate recessions. i) Read the chart, discuss what characteristics of commercial property investment do you learn from the chart. (6 Marks) ii) Discuss how would these characteristics influence the discount rate for commercial real estate in the UK. (6 Marks) iii) Explain why defalut-free real interest rates tend to be relatively high in countries with high expected economic growth. (6 Marks)
Step by Step Solution
There are 3 Steps involved in it
Step: 1
Get Instant Access to Expert-Tailored Solutions
See step-by-step solutions with expert insights and AI powered tools for academic success
Step: 2
Step: 3
Ace Your Homework with AI
Get the answers you need in no time with our AI-driven, step-by-step assistance
Get Started