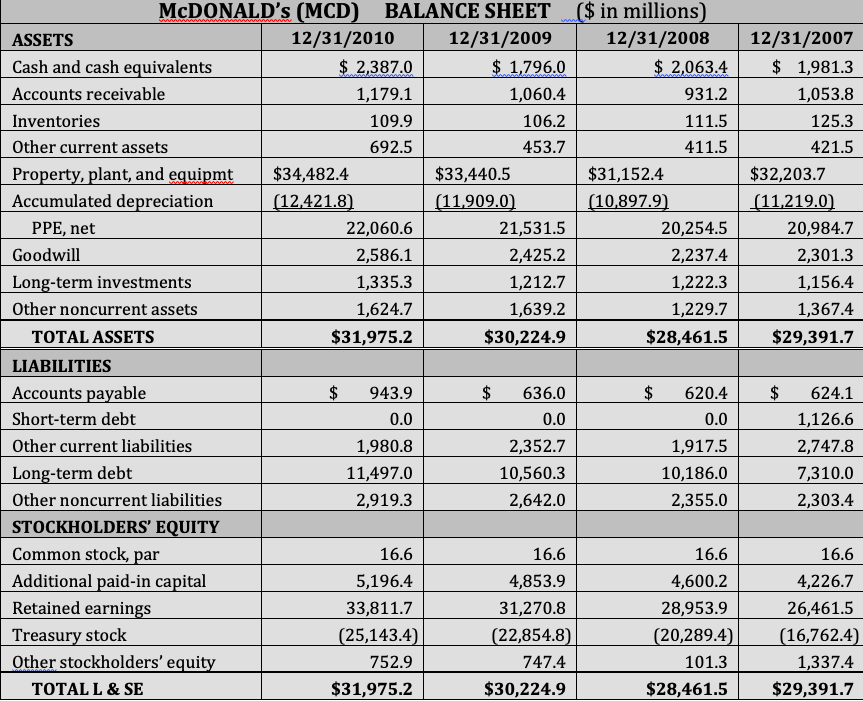
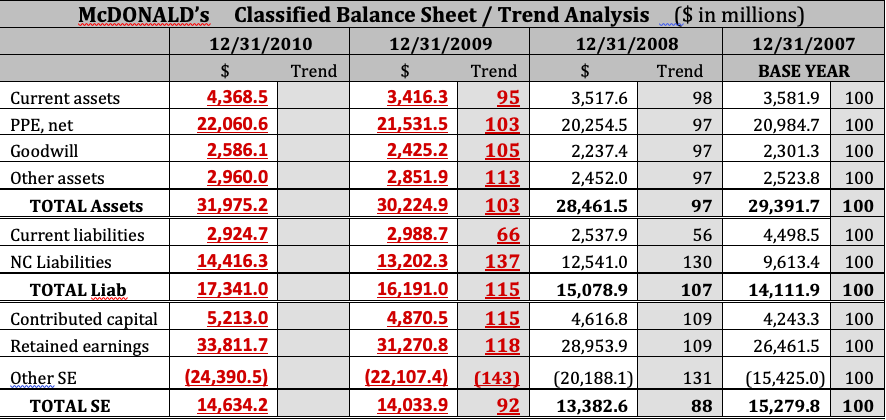
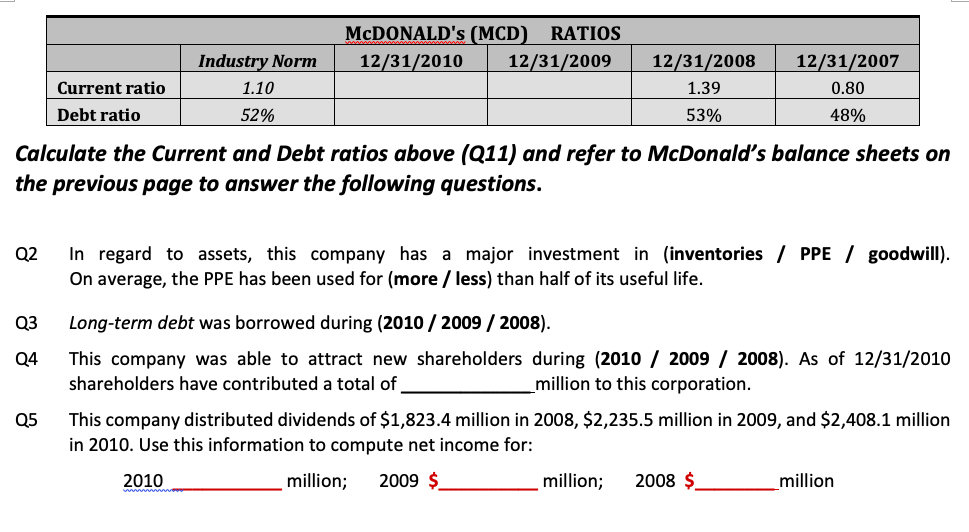
12/31/2007 $ 1,981.3 1,053.8 125.3 421.5 $32,203.7 (11,219.0) 20,984.7 2,301.3 1,156.4 1,367.4 $29,391.7 McDONALD's (MCD) BALANCE SHEET ($ in millions) ASSETS 12/31/2010 12/31/2009 12/31/2008 Cash and cash equivalents $2,387.0 $ 1,796.0 $ 2,063.4 Accounts receivable 1,179.1 1.060.4 931.2 Inventories 109.9 106.2 111.5 Other current assets 692.5 453.7 411.5 Property, plant, and equipmt $34,482.4 $33,440.5 $31,152.4 Accumulated depreciation (12,421.8) (11,909.0) (10,897.9) PPE, net 22,060.6 21,531.5 20,254.5 Goodwill 2,586.1 2,425.2 2,237.4 Long-term investments 1,335.3 1,212.7 1,222.3 Other noncurrent assets 1,624.7 1,639.2 1,229.7 TOTAL ASSETS $31,975.2 $30,224.9 $28,461.5 LIABILITIES Accounts payable $ 943.9 $ 636.0 $ 620.4 Short-term debt 0.0 0.0 0.0 Other current liabilities 1,980.8 2.352.7 1,917.5 Long-term debt 11,497.0 10,560.3 10,186.0 Other noncurrent liabilities 2,919.3 2,642.0 2,355.0 STOCKHOLDERS' EQUITY Common stock, par 16.6 16.6 16.6 Additional paid-in capital 5,196.4 4,853.9 4,600.2 Retained earnings 33,811.7 31,270.8 28,953.9 Treasury stock (25,143.4) (22,854.8) (20,289.4) Other stockholders' equity 752.9 747.4 101.3 TOTAL L & SE $31,975.2 $30,224.9 $28,461.5 $ 624.1 1,126.6 2,747.8 7,310.0 2,303.4 16.6 4,226.7 26,461.5 (16,762.4) 1,337.4 $29,391.7 McDONALD's Classified Balance Sheet / Trend Analysis ($ in millions 12/31/2010 12/31/2009 12/31/2008 12/31/2007 $ Trend $ Trend $ Trend BASE YEAR Current assets 4,368.5 3,416.3 95 3,517.6 98 3,581.9 100 PPE, net 22,060.6 21,531.5 103 20,254.5 97 20,984. 7 100 Goodwill 2,586.1 2,425.2 105 2,237.4 97 2,301. 3 100 Other assets 2,960.0 2,851.9 113 2,452.0 97 2,523.8 100 TOTAL Assets 31,975.2 30,224.9 103 28,461.5 29,391.7 100 Current liabilities 2,924.7 2,988.7 - 66| 2,537.9 56 4,498.5 100 NC Liabilities 14,416.3 13,202.3 137 12,541.0 130 9,613.4 100 TOTAL Liab 17,341.0 16,191.0 115 15,078.9 107 14,111.9 100 Contributed capital 5,213.0 4,870.5 115 4,616.8 4,243.3 100 Retained earnings 33,811.7 31,270.8 118 28,953.9 109 26,461.5 100 Other SE (24,390.5) (22,107.4) (143) (20,188.1)| 131 | (15,425.0)| 100 TOTAL SE 14,634.2 14,033.9 92 13,382.6 88 15,279.8 | 100 97 109 McDONALD's (MCD RATIOS 12/31/2010 12/31/2009 Industry Norm 1.10 52% Current ratio Debt ratio 12/31/2008 1.39 53% 12/31/2007 0.80 48% Calculate the Current and Debt ratios above (Q11) and refer to McDonald's balance sheets on the previous page to answer the following questions. Q2 In regard to assets, this company has a major investment in (inventories / PPE / goodwill). On average, the PPE has been used for (more / less) than half of its useful life. Q3 Long-term debt was borrowed during (2010 / 2009 / 2008). This company was able to attract new shareholders during (2010 / 2009 / 2008). As of 12/31/2010 shareholders have contributed a total of million to this corporation. This company distributed dividends of $1,823.4 million in 2008, $2,235.5 million in 2009, and $2,408.1 million in 2010. Use this information to compute net income for: 2010 _million; 2009 $_ million; 2008 $_ million Q5 12/31/2007 $ 1,981.3 1,053.8 125.3 421.5 $32,203.7 (11,219.0) 20,984.7 2,301.3 1,156.4 1,367.4 $29,391.7 McDONALD's (MCD) BALANCE SHEET ($ in millions) ASSETS 12/31/2010 12/31/2009 12/31/2008 Cash and cash equivalents $2,387.0 $ 1,796.0 $ 2,063.4 Accounts receivable 1,179.1 1.060.4 931.2 Inventories 109.9 106.2 111.5 Other current assets 692.5 453.7 411.5 Property, plant, and equipmt $34,482.4 $33,440.5 $31,152.4 Accumulated depreciation (12,421.8) (11,909.0) (10,897.9) PPE, net 22,060.6 21,531.5 20,254.5 Goodwill 2,586.1 2,425.2 2,237.4 Long-term investments 1,335.3 1,212.7 1,222.3 Other noncurrent assets 1,624.7 1,639.2 1,229.7 TOTAL ASSETS $31,975.2 $30,224.9 $28,461.5 LIABILITIES Accounts payable $ 943.9 $ 636.0 $ 620.4 Short-term debt 0.0 0.0 0.0 Other current liabilities 1,980.8 2.352.7 1,917.5 Long-term debt 11,497.0 10,560.3 10,186.0 Other noncurrent liabilities 2,919.3 2,642.0 2,355.0 STOCKHOLDERS' EQUITY Common stock, par 16.6 16.6 16.6 Additional paid-in capital 5,196.4 4,853.9 4,600.2 Retained earnings 33,811.7 31,270.8 28,953.9 Treasury stock (25,143.4) (22,854.8) (20,289.4) Other stockholders' equity 752.9 747.4 101.3 TOTAL L & SE $31,975.2 $30,224.9 $28,461.5 $ 624.1 1,126.6 2,747.8 7,310.0 2,303.4 16.6 4,226.7 26,461.5 (16,762.4) 1,337.4 $29,391.7 McDONALD's Classified Balance Sheet / Trend Analysis ($ in millions 12/31/2010 12/31/2009 12/31/2008 12/31/2007 $ Trend $ Trend $ Trend BASE YEAR Current assets 4,368.5 3,416.3 95 3,517.6 98 3,581.9 100 PPE, net 22,060.6 21,531.5 103 20,254.5 97 20,984. 7 100 Goodwill 2,586.1 2,425.2 105 2,237.4 97 2,301. 3 100 Other assets 2,960.0 2,851.9 113 2,452.0 97 2,523.8 100 TOTAL Assets 31,975.2 30,224.9 103 28,461.5 29,391.7 100 Current liabilities 2,924.7 2,988.7 - 66| 2,537.9 56 4,498.5 100 NC Liabilities 14,416.3 13,202.3 137 12,541.0 130 9,613.4 100 TOTAL Liab 17,341.0 16,191.0 115 15,078.9 107 14,111.9 100 Contributed capital 5,213.0 4,870.5 115 4,616.8 4,243.3 100 Retained earnings 33,811.7 31,270.8 118 28,953.9 109 26,461.5 100 Other SE (24,390.5) (22,107.4) (143) (20,188.1)| 131 | (15,425.0)| 100 TOTAL SE 14,634.2 14,033.9 92 13,382.6 88 15,279.8 | 100 97 109 McDONALD's (MCD RATIOS 12/31/2010 12/31/2009 Industry Norm 1.10 52% Current ratio Debt ratio 12/31/2008 1.39 53% 12/31/2007 0.80 48% Calculate the Current and Debt ratios above (Q11) and refer to McDonald's balance sheets on the previous page to answer the following questions. Q2 In regard to assets, this company has a major investment in (inventories / PPE / goodwill). On average, the PPE has been used for (more / less) than half of its useful life. Q3 Long-term debt was borrowed during (2010 / 2009 / 2008). This company was able to attract new shareholders during (2010 / 2009 / 2008). As of 12/31/2010 shareholders have contributed a total of million to this corporation. This company distributed dividends of $1,823.4 million in 2008, $2,235.5 million in 2009, and $2,408.1 million in 2010. Use this information to compute net income for: 2010 _million; 2009 $_ million; 2008 $_ million Q5